Issues are mounting and the pressure is definitely weighing on the bulls. While we haven't seen any major breakdowns to confirm several bearish signs, you should be approaching the market with caution in my opinion.
In my last article, I discussed one of the warning signs - the significant outperformance of defensive sectors as traders become much more risk-averse. History tells me that it's time to be cautious when money rotates exclusively to defensive groups.
Let's talk about two more problems.
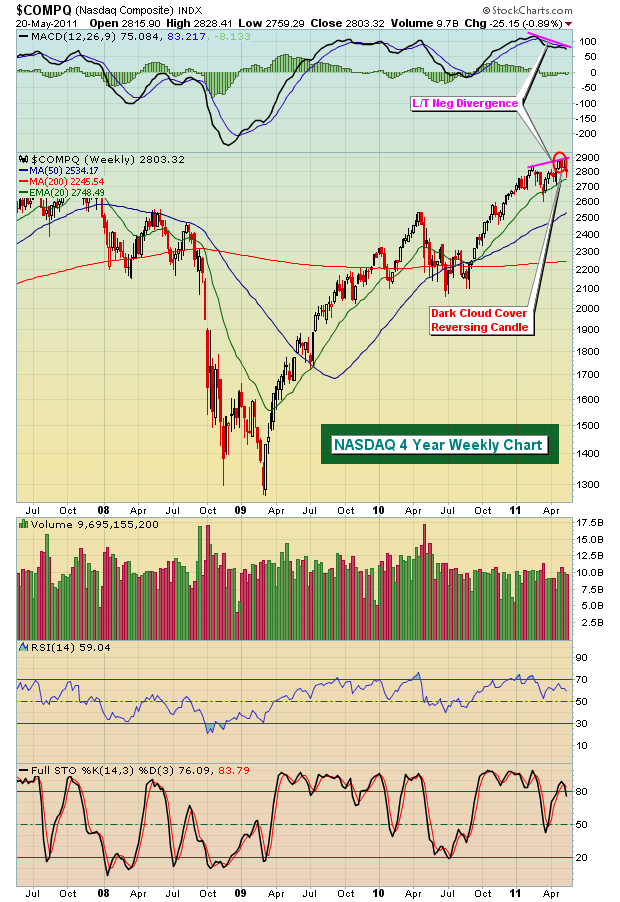
First, there are clear long-term negative divergences across all of our major indices on their respective weekly charts. There's also one on the Dow Jones Transportation Index and another on the Dow Jones REIT Index. The REIT index is one of the few financial sub-sectors that has been performing well. Take a look below at the NASDAQ weekly chart:
When MACD's move higher with price, I look for pullbacks to the 20 week EMA to hold as support. But when slowing momentum surfaces, as evidenced by lower MACD readings on higher highs in price, those 20 week EMAs become much more susceptible to bear attacks. Generally, the odds of 50 week SMAs increase in order to "reset" the MACDs back near the centerline. So as we look at the NASDAQ chart above, note that the 50 week SMA currently resides at 2534 and is rising. Over the next several weeks, I will be very surprised if we don't see a test of this moving average, at a minimum.
Weekly negative divergences don't necessarily mean a bear market is approaching, but that is one possibility that we need to consider. Price reaction off the 50 day SMA test, volume trends, sentiment, and other indications all factor into making that assessment.
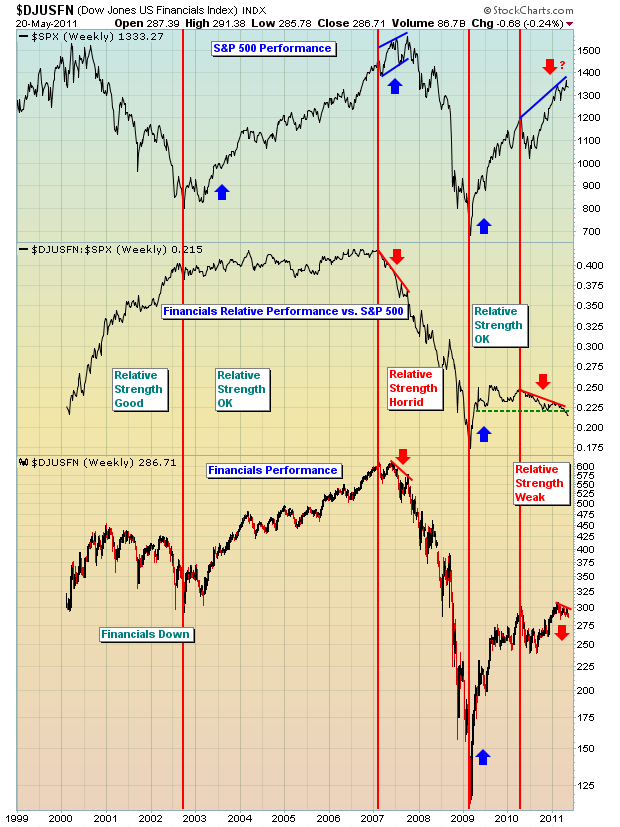
Another problem the bulls face is the relative performance of financial stocks. The following chart shows the relative performance of financials and the overall performance on the S&P 500:
This is quite a compelling visual and helps to explain why I view it so often. And it makes complete sense. When fnancials are unhealthy and underperforming, banks cut their lending despite what they say. How can our economy continue to expand when access to capital is denied or limited? Look at how the relative performance of financials turned south in 2007 just before the S&P 500 followed suit. With financials again struggling badly on a relative basis, this could once again signal significant weakness ahead on the S&P 500. If you're a bull, you really want to see financials regain some relative strength and SOON!
I've had incredibly positive feedback for our MACD Boot Camp so thanks to all those who registered. It won't likely remain available for long, so if you haven't checked it out, do yourself a favor and sign up. It's FREE! CLICK HERE for easy registration.
I'll also be discussing my proprietary Equity Only Put Call Ratio (EOPCR) on Thursday of this week as part of our ongoing monthly Online Trader Series educational events. The EOPCR has been a huge part of my success in identifying market tops and bottoms. I'll be describing my methodology and explaining how it works. This one is really a must-see for swing traders. If interested, you can CLICK HERE to register for this online event.
Happy trading!


