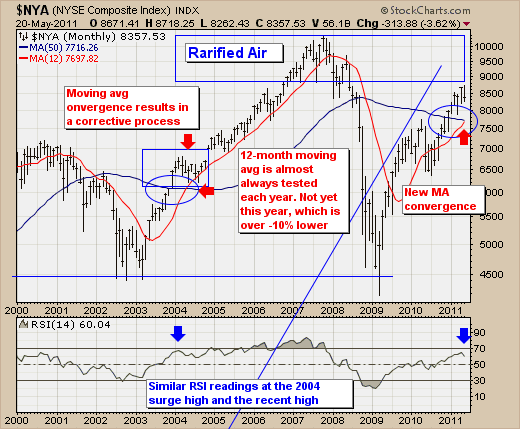
Since the end of April, the broader market as defined by the NYSE Composite Index has been in a corrective mode. However, the question remains as to whether this corrective process will continue in the weeks and months ahead, or will it come to a halt with the materialization of higher highs. We stand on the side of a correction in the months ahead.

To this end, the NYSE monthly chart illustrates a simple, yet elegant reason for the corrective process to continue: the 50-month and 12-month moving averages are converging. In the past when this has occurred - note the 2004 convergence - prices began to falter in the months leading up to these moving averages actually crossing. The very same circumstance is occurring today, and it also occurs with the 14-month RSI hitting very close to the very same level as in 2004. Moreover, we should note that the 12-month moving average is very rarely not tested at anytime during a year, which given the market has completed nearly 5-months of trading...gives us 7-months for it to be tested. At present, it stands a bit more than -10% current market levels, and we could very well see prices and the 12-month converging by late-summer of early fall.
Therefore, the risk-reward is skewed towards lower prices in the months ahead, which fits nicely with the seasonal patterns. But at this point, we only look for this correction to test moving average support before prices move higher - perhaps in response to a need to QE-3 if the economy continues to falter such as it is today.
