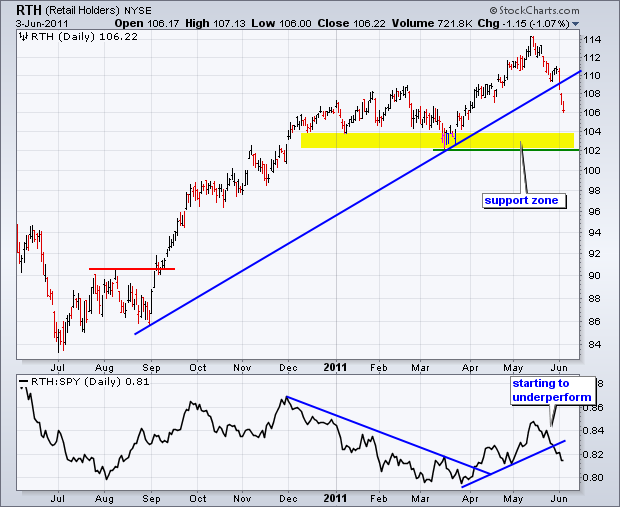
With economic indicators and employment statistics coming up short this week, retail stocks came under considerable selling pressure. Led by weakness in Wal-Mart and Home Depot, the **Retail HOLDRS (RTH)** is down some 7% the last few weeks. Chart 7 shows RTH breaking the trendline extending up from early September. RTH is clearly in a short-term downtrend with the next big support zone in the 102-104 area. As far as the long-term trend is concerned, note that a major topping pattern has yet to take shape. We have yet to see a Double Top, Head-and-Shoulders or some other distribution pattern unfold. Moreover, we have yet to see a major support break. This means it is still too early to label the big trend down on this chart.

Click this image for a live chart.
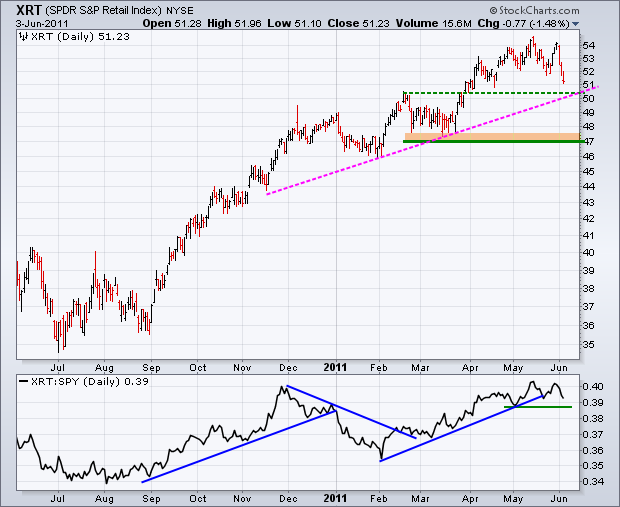
The second chart shows the Retail SPDR (XRT) taking a hit over the last three days. The ETF is poised to test support just above 50. This support level stems from the November trendline and broken resistance. The Price Relative (XRT:SPY ratio) has yet to break down either. The ratio flattened the last two months with the early May low marking support. A break below this level would indicate relative weakness in XRT.

Click this image for a live chart.
