Hello Fellow ChartWatchers!
Today I'm pleased to announce another major upgrade to StockCharts.com. We've just added end-of-day data for US futures contracts as well as end-of-day spot prices to our system. The data is available for free to everyone. When you combine that with our recent addition of London, Euronext, and German stock data, you'll discover that over the course of the past two months, we added over 2,500 new, free symbols to our database - the largest expansion we've ever had (and we're still not done...) Here are more details on each of these two important changes:
THE RETURN OF OHLC DATA FOR OUR COMMODITY INDEXES
Last month when we completed our transition from our old data vendor to our new data parter, Interactive Data, we discovered that the Open, High, and Low values we had been getting for our various end-of-day commodity indexes like $GOLD and $USD didn't match the values we were expecting to see. Because of those data consistancy issues, we changed those indexes into "Close-only" datasets something that proved to be very unpopular with many of our users. (Frankly we were very surprised by the amount of negative feedback we received at that time.)
At the time we made the change, I wrote the following in my blog:
"It has always been StockCharts.com's intention to add legitimate, tradable futures data to our website at some point. It is still our intention to do that. [...] We are continuing to look for possible "middle-ground" solutions which would allow us to provide, for example, delayed spot prices for popular commodities."
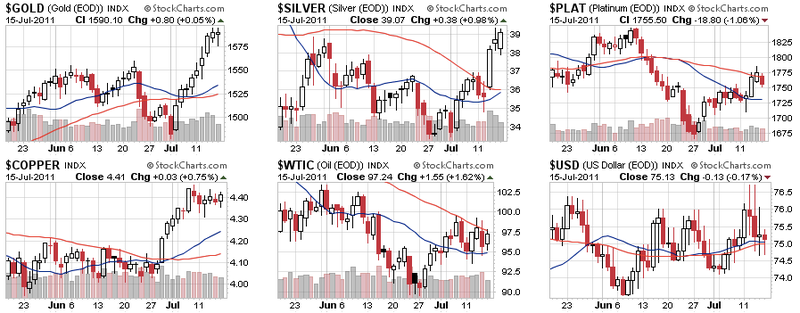
Today's good news is that we have been able to acquire the data we need to provide end-of-day, OHLC spot prices for all of our commodity-based indexes. This means that you are now able to create daily bar and candlestick charts for $GOLD, $SILVER, $COPPER, $NATGAS, $USD, $WTIC and more AND that the data is based on actual futures trading data straight from the futures exchanges. Check it out:

(Click on the chart to see a live version of these charts.)
Important Note: This change means that we have fundamentally changed the nature of our commodity-based indexes. They are no longer based on "Continuous Contract" calculations. They are based on actual trading data. The historical data on these charts has been replaced with Spot price data and that may have altered previously saved charts - especially those with annotations as well as P&F charts. We apologize for any issues this change has caused but hopefully everyone will agree that having data based on actual trading is a much better approach.
Speaking of actual trading data...
END-OF-DAY CHARTS FOR FUTURES CONTRACTS
In addition to updating our commodity indexes, we've added end-of-day data for many important Futures contracts to our system. That means that you can now chart, for example, the daily changes in the August Gold contract or the December contract for the US Dollar or the contract for Light Crude Oil in June of 2012.
Here's a list of the US Futures contracts that we currently support:
^CL - Light Crude Oil
^DX - US Dollar Index
^GC - Gold
^HG - Copper
^HO - Heating Oil
^NG - Natural Gas
^PA - Palladium
^PL - Platinum
^RB - Gasoline
^SI - Silver
(For those of you who are not familiar with futures, the complete ticker symbol for a futures contract is the prefix - listed above - plus a one letter character that represents the month that the contract expires in plus the last two digits of the year the contract expires in. For example, the complete symbol for August 2012 Natural Gas is ^NGQ12.)
We will be adding currency contracts and contracts for financial instruments like the S&P eMini over the course of the next couple of weeks. To get an up-to-date list of the contracts we provide, use of Symbol Search tool and search for "^" (or just click here).
Again, all of these symbols are based on end-of-day data and are thus free for everyone to use. These charts should be valuable to casual and longer-term futures traders as well as equities traders that want to keep up with the details of the futures markets. Enjoy!
- Chip Anderson
P.S. I know that the active futures traders out there are now probably wondering "When will StockCharts have intraday and/or real-time futures charts?" Unfortunately, the answer to that is still unclear. I can tell you that it's not going to happen in the near future. There are many technical and legal hurdles that still need to be overcome. The good news is that these end-of-day charts have laid much of the technical groundwork necessary for us to provide intraday commodities data at some point in the future. Stay tuned...
