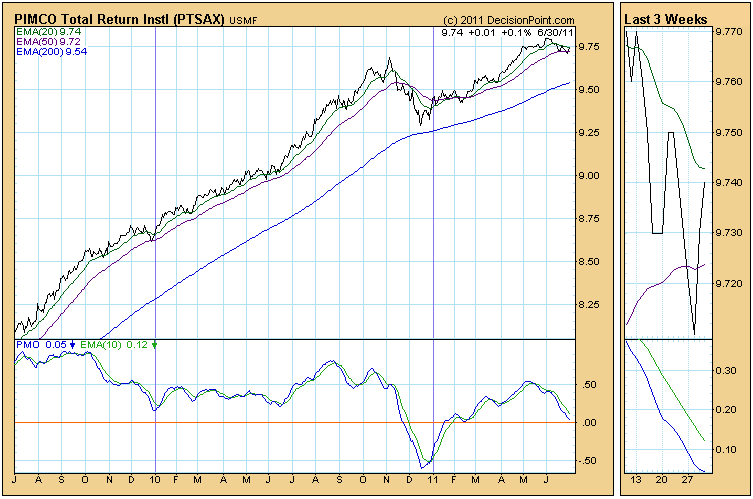
QUESTION: Carl, is it okay to use the Trend Model on bond fund NAV's to manage risk, or is it inappropriate because you can't factor in monthly payouts? I own PTSAX, Bill Gross' total return investor class bond fund, and it looks like the 20-EMA is ready to cross down through the 50-EMA. I don't want to sell it if I can help, but I will if I have to. Gross is probably the best out there but the fund has been seeing some noticeable weakness of late.
ANSWER: Distributions occur with stocks and mutual funds, and it is important for investors to understand what they are and how they affect prices. When a company or mutual fund makes a distribution, they are transferring company/fund assets to shareholders, and prices need to be adjusted to reflect the fact that the company/fund no longer owns those assets. (Note: A dividend is a distribution.)
The distribution where this is most obvious is a stock split. In a 2 for 1 split the company distributes additional shares to shareholders so that they will own twice as many shares after the split. On the day of the split (the ex-distribution date) the price of the stock is halved, and historical prices are divided by two. If historical prices were not adjusted, the chart would be useless because on the day of the split it would show a 50% decline. Click here to learn more.
Our Trend Model is driven by exponential moving average (EMA) crossover, so it is important that the historical data of a given mutual fund is adjusted for distributions. As with most bond mutual funds, PTSAX makes small monthly distributions and PTSAX historical data are adjusted each time by StockCharts.com, whose data we use.
As for applying the Trend Model to a particular price index, we would want to select a low volatility index. PTSAX certainly fills the bill in that regard. It "tends to trend" rather than jump all over the place. In the case of a mutual fund we cannot sell it short, so we are only concerned with 20-EMA and 50-EMA crossovers. When the 20-EMA crosses up through the 50-EMA, it is a buy signal. When the 20-EMA crosses down through the 50-EMA, it s a signal to exit the position.
These rules do not work perfectly, but they are designed to keep us invested when the trend is favorable, and to eliminate exposure when prices have exhibited sufficient weakness to cause concern.
Bottom Line: Historical prices must be adjusted for distributions or they will be useless for purposes of technical analysis. This is not a recommendation for you to take any specific action, but I believe that our Trend Model is suitable for use with PTSAX, and that it will help you sleep at night knowing that buy and sell decisions are guided by an objective timing tool.

