Hello Fellow ChartWatchers!
With headlines like "Rally in Trouble?", "Start of Correction?" and "VIX Stalls" you'd think that our technical analysts were trying to tell you something...
Regardless of what John, Arthur, Carl and the rest of the gang is hinting at, things could not be more bullish here at StockCharts with regards to a great crop of new features that that can help you get even more value for your online charting dollar.
Things like our new Market Summary page layout and our ChartCon DVD pre-sale are covered later on in the "Site News" section of this newsletter. So I wanted to take a second and talk about the Heikin-Ashi support we added last week.
The "what-what" support?
Heikin-Ashi charts look very similar to regular candlestick charts, but there are several significant differences. Heikin-Ashi candles filters out some noise in an effort to better indicate the prevailing trend. In Japanese, Heikin means "average" and "ashi" means "pace." Taken together, Heikin-Ashi represents the average-pace of prices.
Heikin-Ashi Candlesticks are not used like normal candlesticks. Dozens of bullish or bearish reversal patterns consisting of 1-3 candlesticks are not to be found. Instead, these candlesticks can be used to identify trending periods, potential reversal points and classic technical analysis patterns.
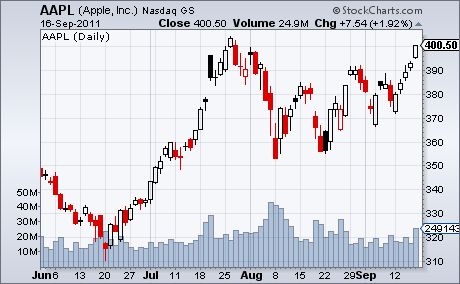
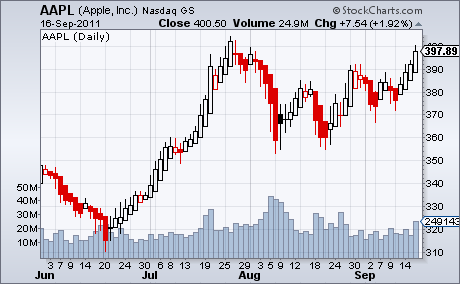
Let's compare a normal Candlestick chart with its Heikin-Ashi equivalent:
(The Heikin-Ashi chart is on the bottom. Click charts for live versions.)
Notice that the Heikin-Ashi chart doesn't contain the gaps that the regular candle chart has. Also notice that lower shadows are generally missing from the rising candles and upper shadows are missing from the falling candles. All of these characteristics stem from how Heikin-Ashi candles are constructed. For the gory details, please see our ChartSchool article.
The key takeaway is that Heikin-Ashi candles reduce raw volatility in favor of indicating the overall trend more clearly.
Just another tool to add to your charting arsenal.
Enjoy,
- Chip
P.S. People have asked if we can scan for Heikin-Ashi chart patterns. The Scan Engine doesn't currently support Heikin-Ashi charts because, fundamentally, Heikin-Ashi charts use different data than the OHLC values that the Scan Engine is designed to work with. Unfortunately, that isn't going to happen any time soon.


