The US Dollar Index appears to be setting up for a medium-term double top. This week it broke down through a short-term rising trend line drawn from the October low after reaching a level equal to the October top. The PMO made a lower top, creating a negative divergence.
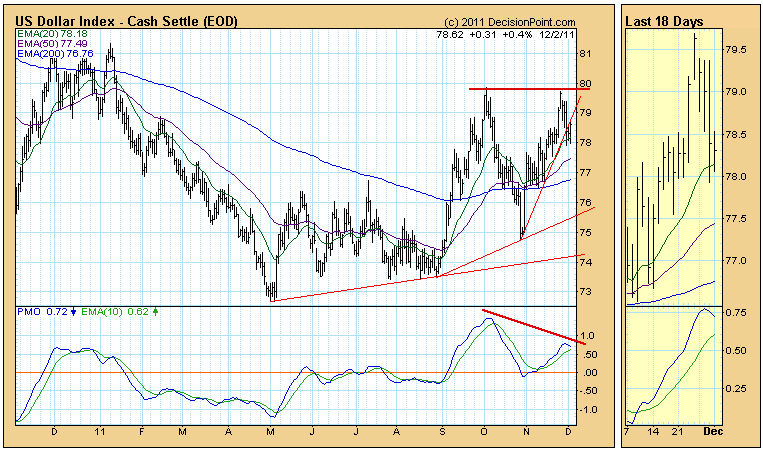
The 20-EMA crossed up through the 50-EMA in early September, generating a Trend Model BUY signal. The 50-EMA crossed up through the 200-EMA signaling that The Dollar Index is now in a long-term bull market. Since the EMAs are in a bullish configuration, it is less likely that a full bearish outcome will transpire, but we could see a decline to suport at the 200-EMA or the rising trend line drawn through the August and October lows.
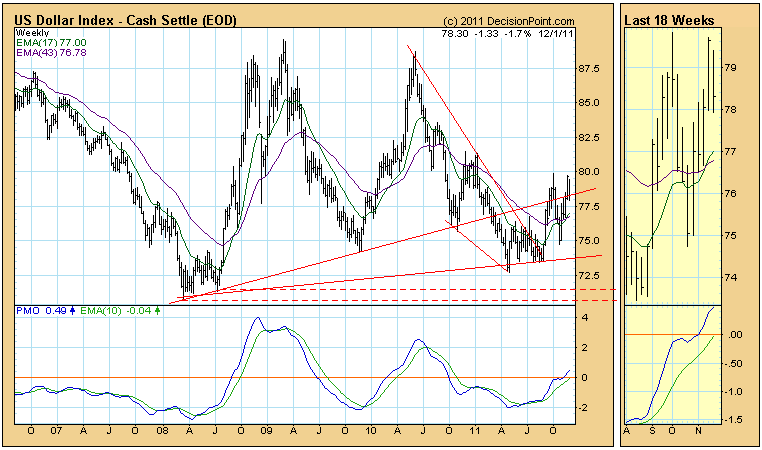
The Weekly chart presents a positive picture with a rising PMO and positively configured EMAs.
Bottom Line: The Dollar Index has been particularly vulnerable to the alternating extremes of attitude within the investing community of panic and relief brought on by the global debt crisis; however, while the charts refelct this volatility, they also seem to reflect a tendency toward a positive outcome in the long run.
