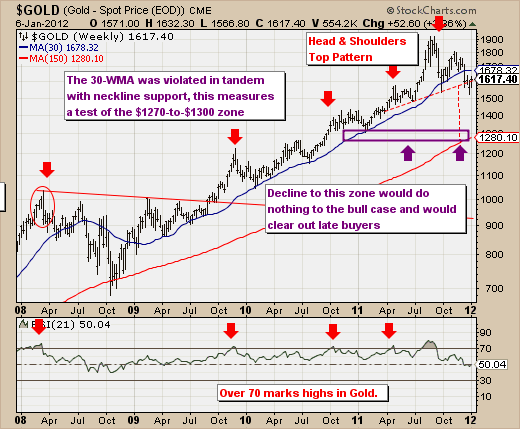
The downside violence in the Gold market as abated for the the time being given the reallocation and repositioning for the New Year. There are many the recent drop is sufficiently of the cathartic-type that will send prices to all-time highs, for we all know that "all the current roads lead to inflation - at some point" as the worlds' central bankers continue to print money. However, we are of the opinion that gold prices have further downside work to do before a strong bottom is formed that will indeed be sufficient for higher highs.
Our opinion stems from the gold chart, and the fact that gold has clearly broken below its 30-week moving average. In the process of doing so, a "head & shoulders" top pattern was confirmed, which now measures lower into $1280-*to-$1300 zone. This is currently where the 150-week moving average, which is where the 2008 correction feel to and then turned prices higher. Another interesting historic technical metric, the percentage below the 30-week moving average in which gold generally bottoms is between -12% and -17% below it - which would put prices in the range of $1476 to $1392. This zone was not tested on the most recent decline, so there is likely more downside forthcoming. .
Therefore, we are most interested in the 150-week moving average, and where it trades as time goes forward.

