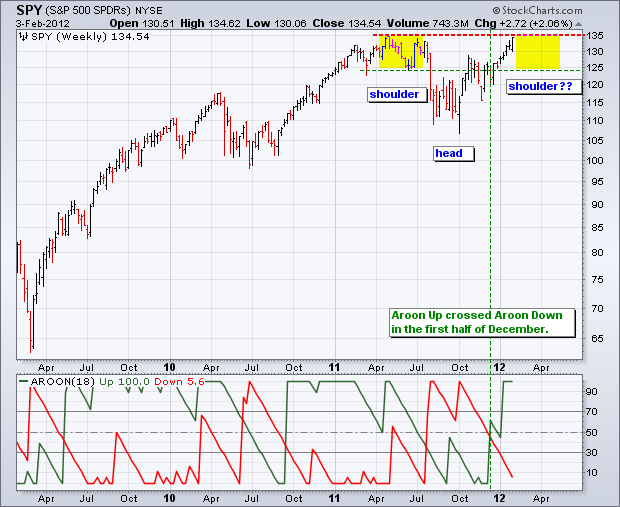
With a string of positive economic reports lifting stocks this week, the S&P 500 ETF (SPY) closed higher for the fifth consecutive week. Friday was a big reporting day with Factory Orders showing strength, IWM Services indicating expansion and the employment rate coming down. These positive reports should not come as a surprise because stocks, which are a leading indicator, are up sharply since early October. The chart below shows SPY challenging its 2011 highs around 135, a level that marked resistance from April to July. SPY failed at this level last summer and declined rather sharply in late July and early August. Flash forward to 2012 and SPY is once again at resistance and overbought after a sharp advance the last four months. The ETF is up over 25% from its early October low and up over 15% from its late November low. At the risk of over speculating, resistance and these overbought conditions could give way to a corrective period in the coming weeks. Should a sideways consolidation develop between 125 and 135, an inverse head-and-shoulders patterns evolve. Notice that the June lows marks potential support for the right shoulder around 125.
Click this image for a live chart.

