News headlines are usually more confusing than helpful, especially when trying to determine if stocks are overvalued, fairly valued, ot undervalued. At any given time there will be those who simultaneously claim that stocks overvalued and undervalued. Of course, they all have their own methodologies, which (surprise, surprise) support their point of view.
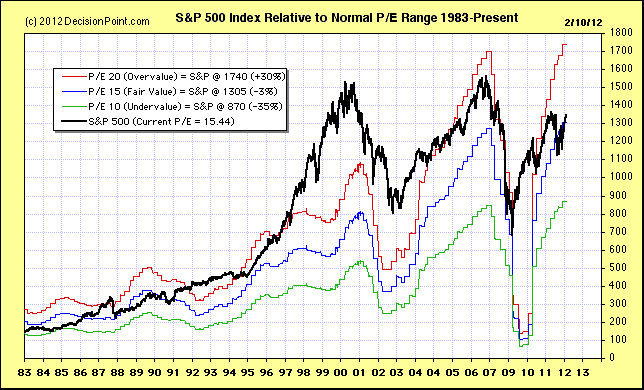
We have always asserted that the most consistent and even-handed way to value stocks is based on their GAAP P/E (price to earnings ratio) relative to the normal historical range. The real P/E for the S&P 500 is based on "as reported" or GAAP earnings (calculated using Generally Accepted Accounting Principles), and it is the standard for historical earnings comparisons. The normal range for the GAAP P/E ratio is between 10 (undervalued) to 20 (overvalued).
Market cheerleaders invariably use "pro forma" or "operating earnings," which exclude some expenses and are deceptively optimistic. They are useless and should be ignored.
The following are the most recently reported and projected twelve-month trailing (TMT) earnings, quarterly earnings, and price/earnings ratios (P/Es) according to Standard and Poors. The 2011 Q4 estimate is based upon 82% of companies having reported. The P/E values are based upon the S&P 500 closing price of 1343 on February 15.

The current P/E of abput 15 falls right in the middle of the historical range of 10 to 20, so we can say that stocks are fairly valued. As technicians we like to show a chart to give perspective. The red, blue, and green lines show where the S&P 500 (the black line) would be if it were overvalued, fairly valued, or undervalued. Note how overvalued the market became in the late 1990s and early 2000s. That is where our troubles began. Then there was the earnings crash on 2009, which completely distorted the range markings. With earnings returning to all-time highs the P/E range is more realistic, and we can reasonably say that stocks are fairly priced.
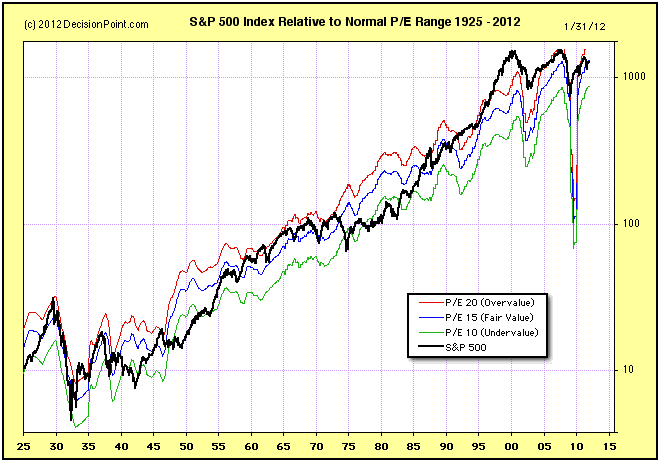
The distortions shown above might cause one to wonder if the normal range concept really has any validity. The long-term chart below demonstrates that it does. It also demonstrates how screwed up the market has been since the late 1990s as compared to the 70 years that preceded that period.
Bottom Line: The TMT GAAP P/E ratio is an objective measure of valuations, although it is a lagging indicator. Currently, earnings have returned to the normal trend, which is up over the long-term, and the price versus the normal P/E range relationship appears to be back in a rational configuration. Therefore, with a P/E of 15, we can say that stocks are fairly valued. This doesn't tell us where prices are headed, but it does support a bullish argument that prices could go higher before they become overvalued (P/E of 20).

About the author:
Carl Swenlin is a veteran technical analyst who has been actively engaged in market analysis since 1981. A pioneer in the creation of online technical resources, he was president and founder of DecisionPoint.com, one of the premier market timing and technical analysis websites on the web. DecisionPoint specializes in stock market indicators and charting. Since DecisionPoint merged with StockCharts.com in 2013, Carl has served a consulting technical analyst and blog contributor.
Learn More

