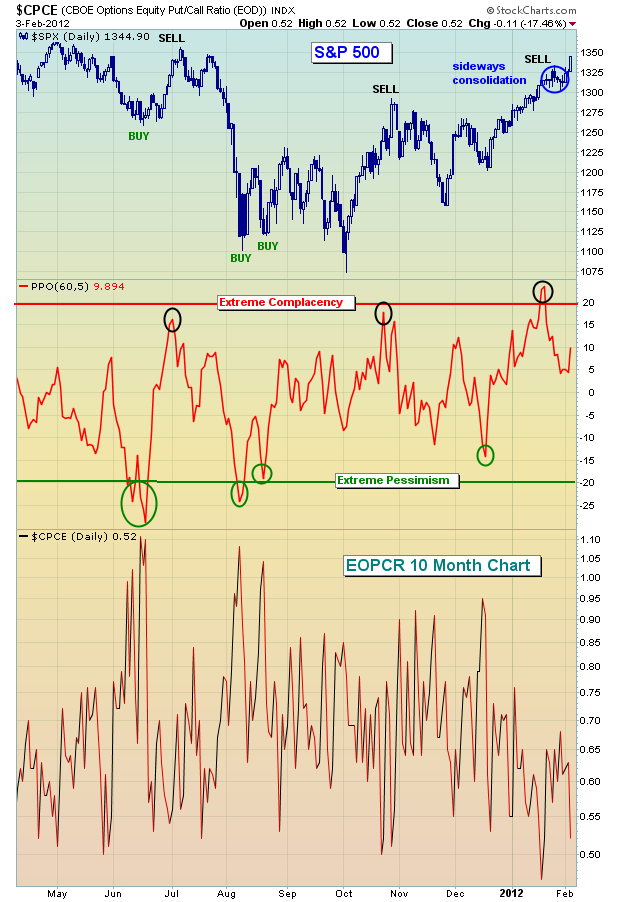
Two weeks ago, I wrote that equities were very overbought and quite complacent. While we didn't see any selling of substance, the market did struggle to move up - that is, until Friday's Nonfarm Payrolls hit the wires. What a blowout number it was!
Let's revisit that EOPCR chart to get a fresh update:
Relative complacency doesn't have quite the track record in marking tops as relative pessimism does in marking bottoms. Nonetheless, it's still a solid indicator and one that everyone should track frequently.
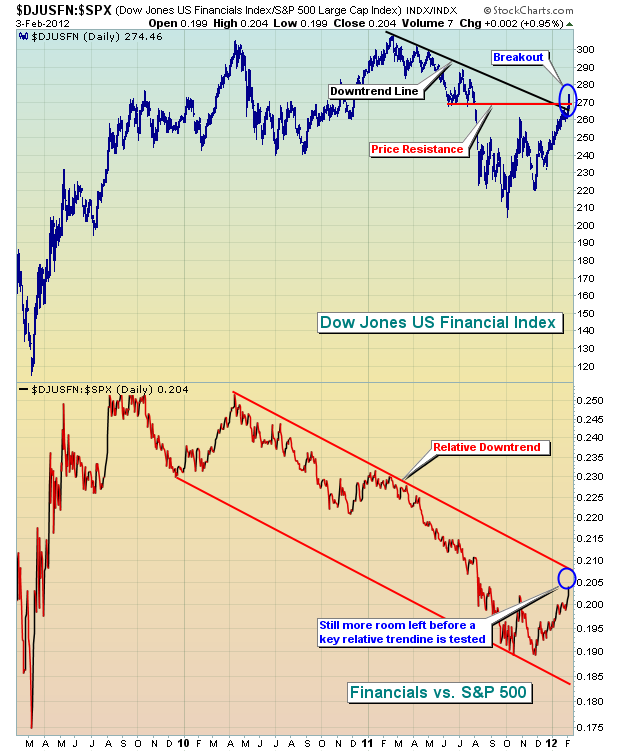
There are lots of positive signals that have emerged during the rally off the mid-December lows. First, I'm ecstatic over the recent absolute and relative performance of financial stocks. If you study history, there's one common denominator that supports nearly every sustainable market rally - a financial sector that AT LEAST performs as well as the S&P 500. And if financials perform better on a relative basis, all the better. Take a look at the Dow Jones US Financial Index ($DJUSFN):
When a sector has performed as badly as the financials have for so long, there are going to be a number of hurdles along the way as the sector recovers. But the good news is that the group is not backing away from a challenge. Instead, it's clearing one hurdle at a time. If that continues, the foundation is set for a continuing rally, with the occasional selloff from overbought territory.
I'm a student of history and one of the most intriguing relationships in the market - from an historical perspective - is the tight positive correlation between January performance on the S&P 500 and the balance of the year. There's an old saying on Wall Street "as goes January, so goes the year". I have to say the numbers support this argument in a VERY convincing way. Since 1950, the top 25% of Januarys have averaged gaining 6.93%. During the balance of those years, only ONE year produced a negative return. The other 14 years produced positive returns over the balance of the year, and 13 of THOSE years moved higher by at least 10% over the final 11 months of the year. What was the AVERAGE balance of year return for this top quartile of Januarys? 17.60%. That's a nice number.
Januarys that fell into the next best 25% (or 2nd quartile) produced balance of year returns of 9.73% - not too shabby as well. Of the 16 years that made up this 2nd quartile of Januarys, 13 produced gains from January 31st through December 31st. So when we consider the top 50% of Januarys, 27 out of 31 moved higher over the balance of the year (after January 31st). That's a very high percentage (27 of 31, or 87%).
If you're wondering about the lower half of Januarys, you should know that out of those 31 Januarys, 19 saw the S&P 500 finish the year higher than it was at January 31st. Remember, the top quartile of Januarys produced an AVERAGE of 17.60% in the balance of the year. The bottom half produced an average balance of year return of 1.59%. That's a far cry from 17.60%.
So the obvious question is - where did January 2012 rank? Well, it was the 13th best January on the S&P 500 since 1950, gaining 4.36%. January 2012 ranks in that top quartile.
I've produced a table showing every year's January and balance of year return since 1950. I've also created an historical boot camp (it's FREE) to educate the investing community about several historical tendencies that every trader and investor MUST know. CLICK HERE for more information.


