Hello Fellow ChartWatchers!
Spring has finally sprung here in the Pacific Northwest and we are very glad that it has. I hope the weather is as nice where you are as it is here. This edition of ChartWatchers contains some great articles - not all of them quite so sunny. John Murphy points out that the sector rotation picture is changing and may have "regressed" somewhat in recent weeks. Arthur Hill looks at the picture for Energy stocks, Carl Swenlin talks about the differences between SPY and $SPX, and Tom Bowley examines the influence that Market Makers have on options expiration day.
And me? I'm going to point out a simple change you can make to your charts that can speed things up - possibly dramatically.
DENSE GRID SETTINGS CONSIDERED HARMFUL
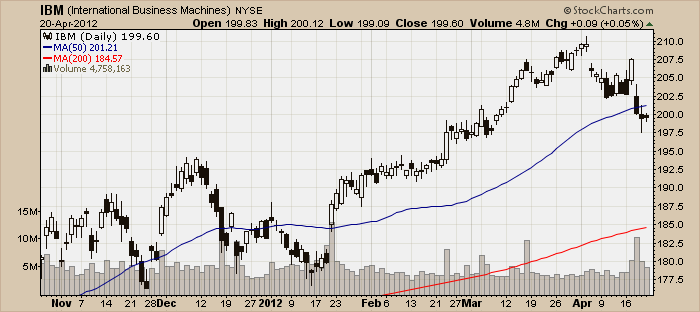
Most of us don't pay any attention to the Grid settings for our charts. Members have the ability to change the number of grid lines that appear on their charts using the "Advanced Settings" controls in the "Chart Attributes" area of the SharpCharts Workbench. Most people are content to use the "Normal" grid settings which looks like this:
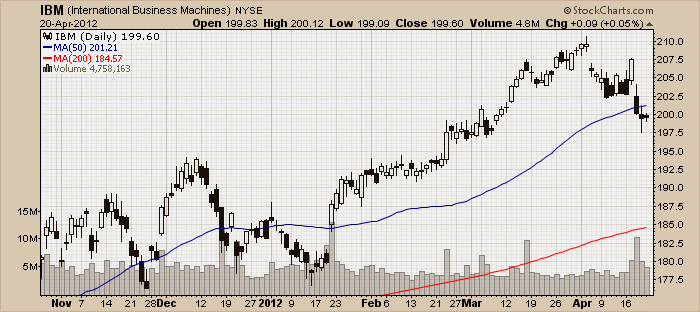
There are two other grid settings that are available however. Here's what the "Dense" grid setting looks like:
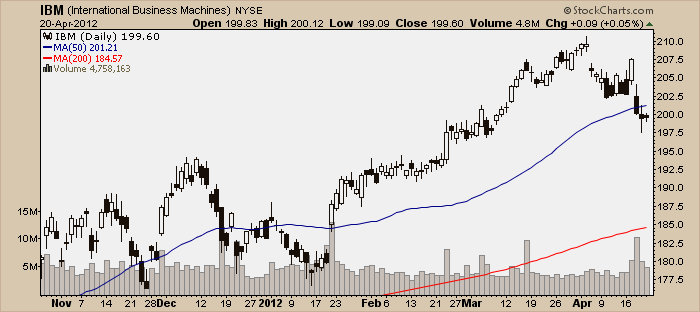
And here is what the "Off" setting looks like:
Now, deciding which of these settings to use is actually a little trickier than you might think at first glance. The reason is that the grid setting can have a very big impact on the size of the chart - not the screen size, but the amount of data that needs to be sent accross the Internet in order for you to see the chart.
Here are the statistics for the simple charts you see above:
- Normal Grid: 12,090 bytes
- Dense Grid: 12,680 bytes
- Grid Off: 10,361 bytes
That may not seem like a big difference - and with such a small, simple chart, it isn't - but even in this case, the chart without a grid is 18% smaller than the chart with a dense grid.
If you use charts that are much larger, say something with a size of 1280 and 4 additional indicator panels, the difference is more significant. Here are the statistics in that case:
- Normal Grid: 83,766 bytes
- Dense Grid: 89,678 bytes
- Grid Off: 65,963 bytes
That's a 26% difference between the size of a chart with a Dense grid and the size of a chart with no grid at all. If your Internet connection is not superfast or you are downloading lots of charts, that different will be noticeable.
Now, of course download speed is only one factor to consider when choosing a grid setting. But I wanted to make sure that it was something that you did consider. From time-to-time we have people write in to our support team asking why our site is so slow and it turns out that they recently turned on the Dense Grid setting. The bottom line here is that if you can live with the grid Off on your charts, you will see a noticeable speed improvement especially if you have large charts or a slow Internet connection.
- Chip
P.S. In case you were wondering, the name of this article is a take-off on a famous letter from the early days of computer programming.


