ChartWatchers May 19, 2012 at 09:28 PM
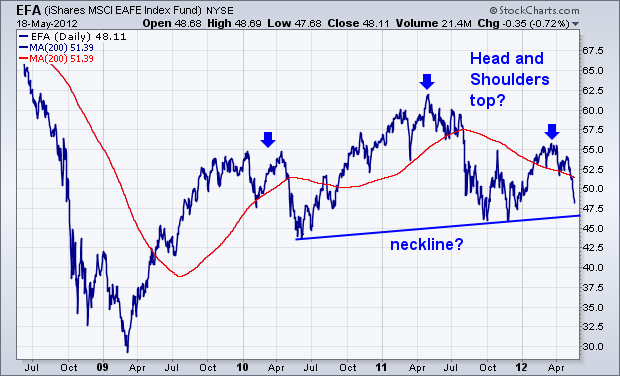
What really worries me about the direction of stocks is the possibility that foreign stock indexes could be tracing out two-year "head and shoulder" tops. That's true of both developed and emerging markets. Chart 1 shows EAFE iShares tracing out a textbook "H&S" top... Read More
ChartWatchers May 19, 2012 at 09:23 PM
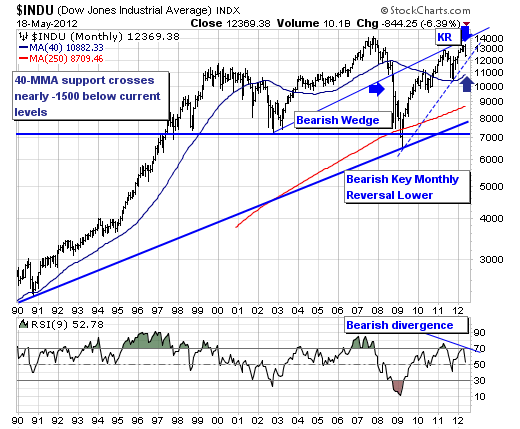
An important tops looks to be in place in the Dow Industrials ($INDU) by month's end if the current pattern holds true to form. Quite simply, the $INDU is forming a bearish wedge pattern, of which rising trendline support looks to be violated in the months ahead... Read More
ChartWatchers May 19, 2012 at 09:17 PM
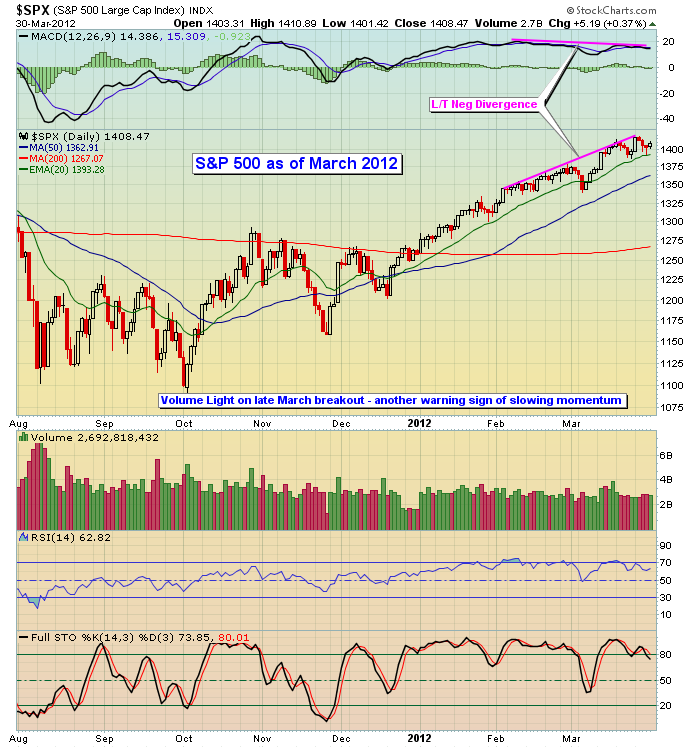
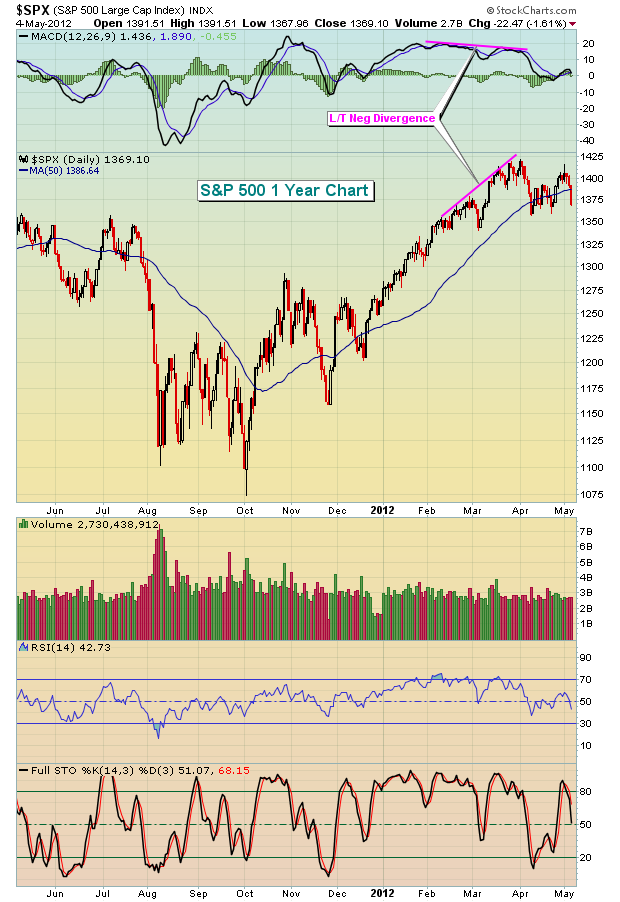
The long-term negative divergences that printed in February and March provided us clues that we'd at least see some near-term trepidation and possibly something much worse. Well, the "much worse" has arrived... Read More
ChartWatchers May 19, 2012 at 02:46 PM
Hello Fellow ChartWatchers! Did you follow the Facebook mania yesterday? Even if you didn't have a stake in the stock, it was still fascinating to watch the chart over the course of the day as the underwriters had to step in to prop it up... Read More
ChartWatchers May 19, 2012 at 11:27 AM
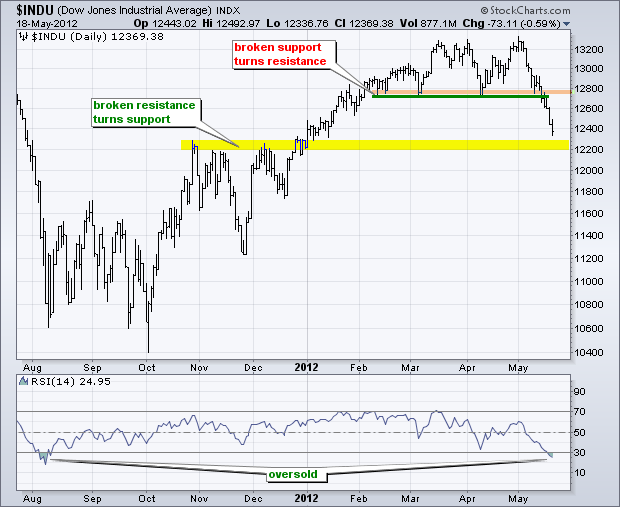
With big declines this past week, the Dow Industrials and Dow Transports both broke support levels and forged lower lows. Confirmed lower lows amount to a Dow Theory sell signal... Read More
ChartWatchers May 18, 2012 at 10:01 PM
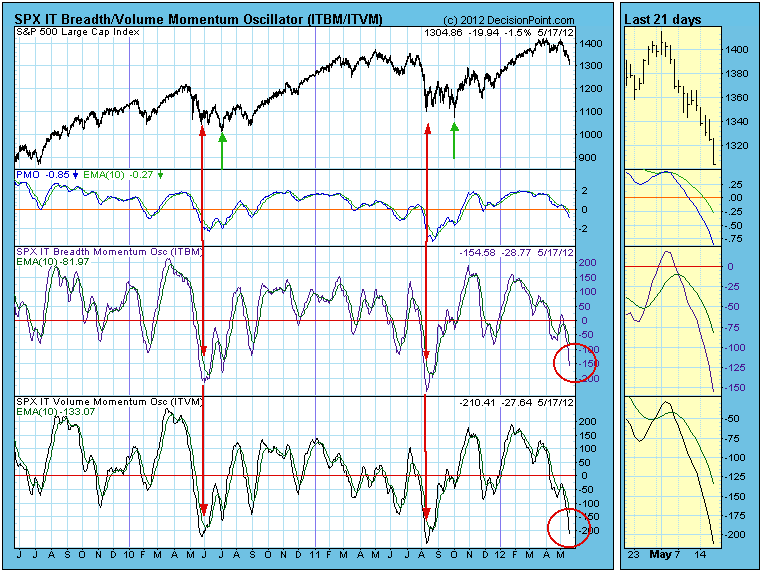
The current correction is creating very oversold conditions on intermediate-term indicators, like the ITBM (breadth) and ITVM (volume)... Read More
ChartWatchers May 06, 2012 at 01:12 PM
Hello Fellow ChartWatchers! One of the big benefits of becoming a StockCharts member is the ability to access additional charting options... Read More
ChartWatchers May 06, 2012 at 03:58 AM
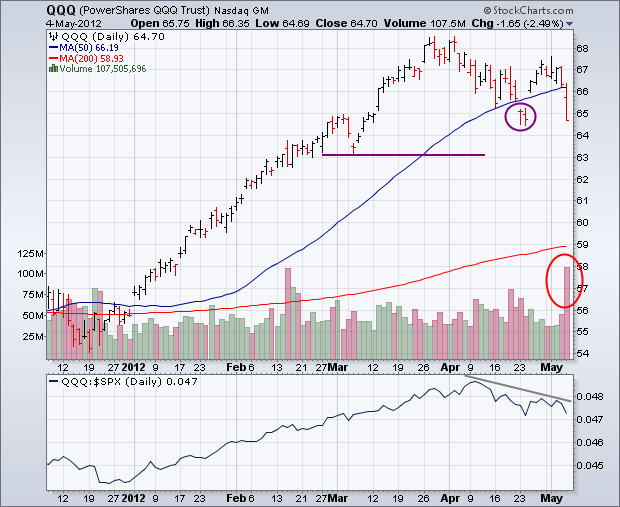
It looks like traders and investors took the "sell in May" mantra seriously this week. Stocks fell sharply after Friday morning's weak April jobs report was released. The worst performance came in the Power Shares QQQ Trust which led the rest of the market lower... Read More
ChartWatchers May 06, 2012 at 03:56 AM
Everything seemed perfectly aligned for the bulls... Read More
ChartWatchers May 05, 2012 at 11:50 AM
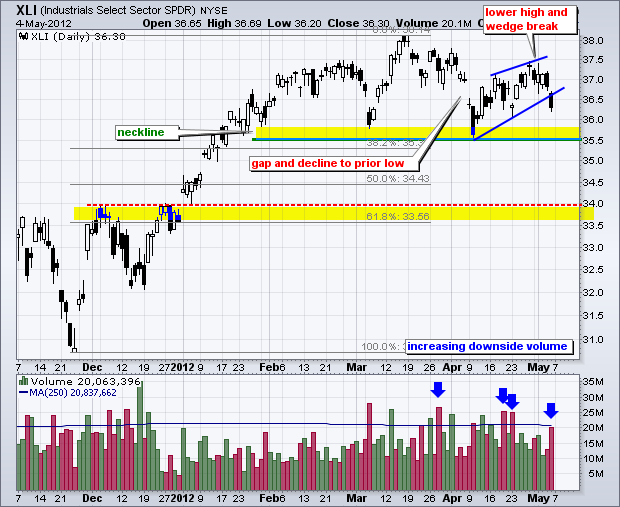
With a gap down and sharp decline, the Industrials SPDR (XLI) formed a lower high and broke wedge support. But that's not all. The chart below also shows a potential head-and-shoulders pattern taking shape... Read More
ChartWatchers May 04, 2012 at 08:56 PM
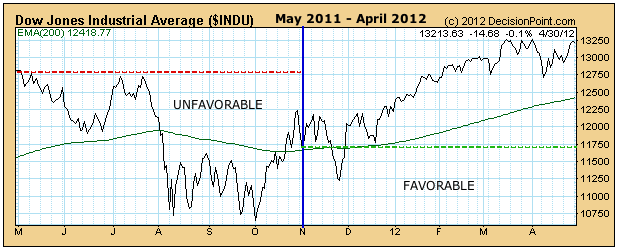
May 1 marked the beginning of a 6-month period of unfavorable seasonality. Research published by Yale Hirsch in the Trader's Almanac shows that the market year is broken into two six-month seasonality periods... Read More