ChartWatchers June 16, 2012 at 06:58 PM
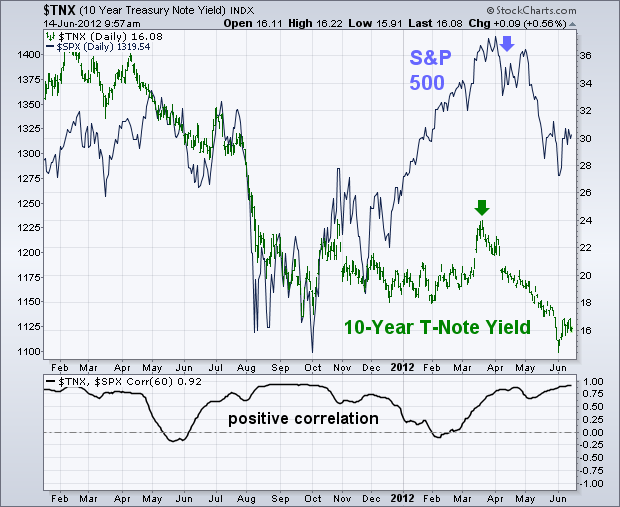
My Tuesday message showed falling commodity prices weighing on stock values. The same is true with Treasury bond yields which have fallen to record lows. Falling bond yields are symptomatic of economic weakness... Read More
ChartWatchers June 16, 2012 at 06:43 PM
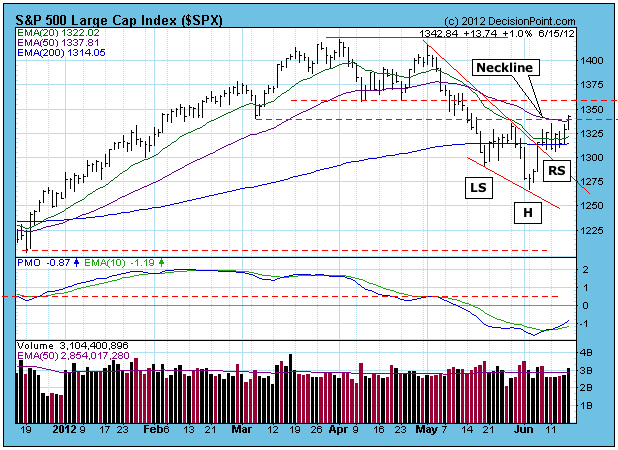
I have been expecting another short decline to finish out the right shoulders of a reverse head and shoulders pattern, but once again the Mr. Market said: "Expect whatever you like. I don't care... Read More
ChartWatchers June 16, 2012 at 05:40 AM
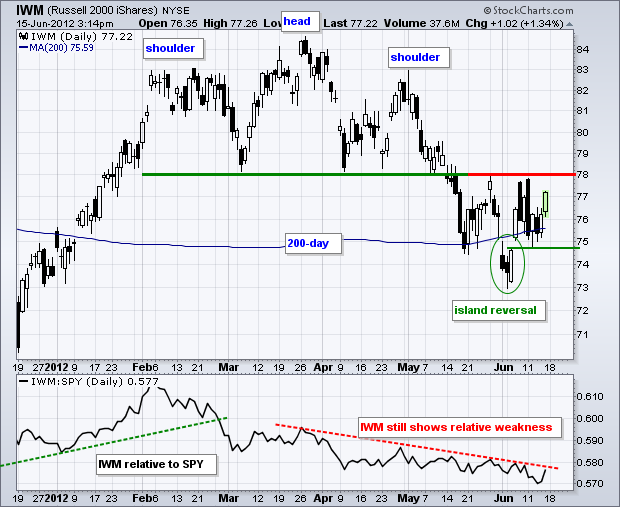
The Russell 2000 ETF (IWM) got a bounce at the end of the week, but remains in a trading range since the June 6th gap. There are two dynamics at work on this chart. First, the medium-term trend is down after the ETF broke neckline support from a head-and-shoulders pattern... Read More
ChartWatchers June 02, 2012 at 08:13 PM
TOP TEN STOCKCHARTS.COM "NOOKS" THAT YOU MIGHT BE MISSING - Every day we hear from people that have just discovered a great little nook of our website that they didn't know about... Read More
ChartWatchers June 02, 2012 at 05:31 PM
Hello Fellow ChartWatchers! The bears are out and pulling the market lower... Read More
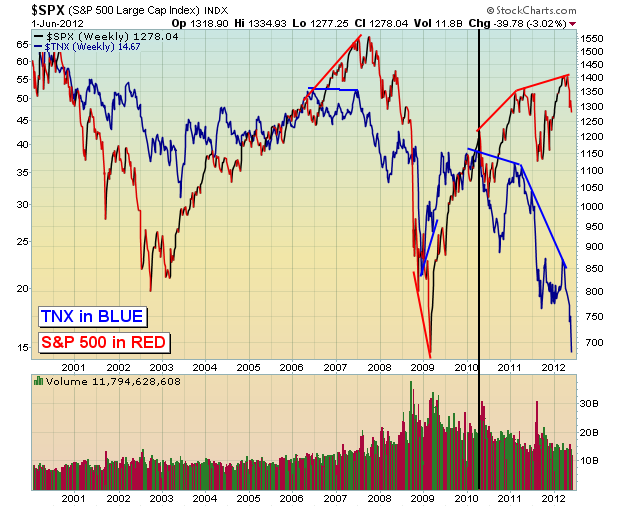
ChartWatchers June 02, 2012 at 05:02 PM
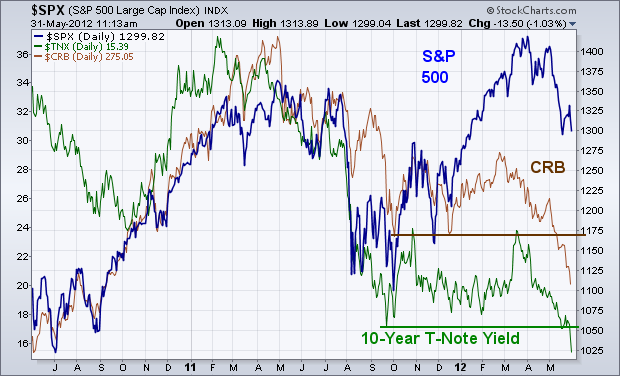
BOND YIELDS AND COMMODITIES HIT NEW LOWS... Everywhere I look I see more serious warning flags for the U.S. stock market. Two of them are coming from recent breakdowns in bond yields and commodity prices... Read More
ChartWatchers June 02, 2012 at 04:51 PM
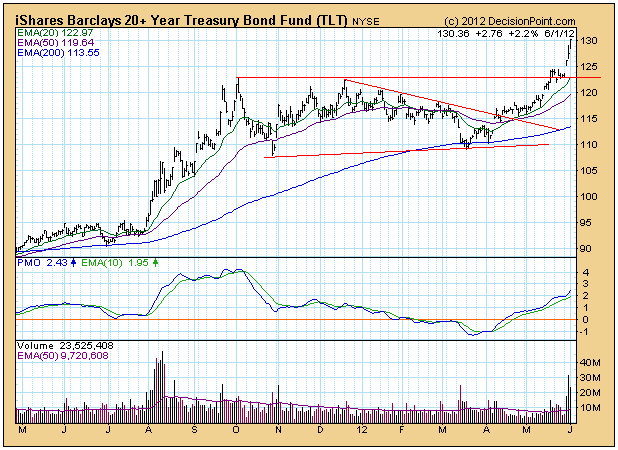
To be honest, the actual "soaring" for bonds began last July when bonds began an advance of about 33% in two months... Read More
ChartWatchers June 02, 2012 at 04:42 PM
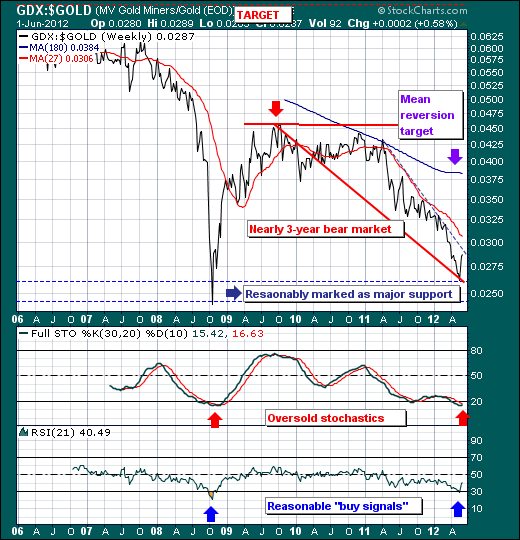
Over the past week, we've seen gold shares gain sponsorship without the physical gold metal rising. Perhaps this was the "canary in the coal mine" as they say, but gold prices roared ahead yesterday from a low of $1545 to a high of $1632 before closing at $1627... Read More
ChartWatchers June 02, 2012 at 04:36 PM
All traders must decide whether to invest their dollars aggressively or conservatively. It's a basic principle, yet following the flow of such dollars can provide us valuable clues about the likely direction of the stock market... Read More
ChartWatchers June 02, 2012 at 06:55 AM
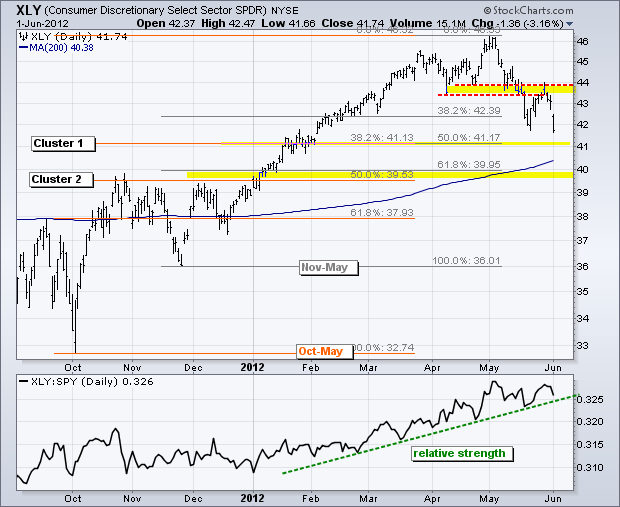
After a failure at broken support, the Consumer Discretionary SPDR (XLY) looks set for a move towards a Fibonacci cluster. The chart below shows XLY breaking support and becoming oversold in mid May... Read More