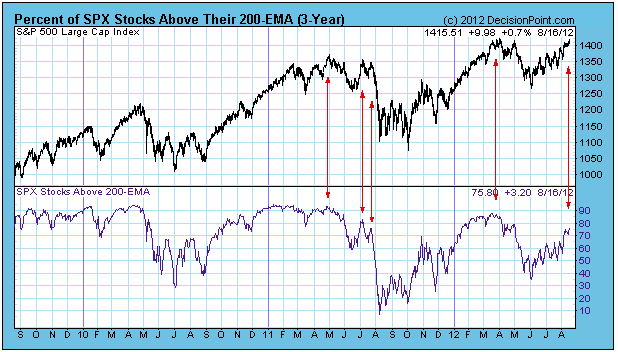
When a stock is above its 200-EMA, it is considered bullish, and in the broadest sense the stock can be considered to be in a long-term rising trend. A good way to determine the amount of support behind a rally is to analyze the percentage of stocks above their 200-EMA.
Decision Point keeps track of this percentage for the S&P 500 Index, and it indicates that there are fewer stocks pushing the SPX to the current highs than there were at the April highs. Also, we can see that the percentage in April was lower than it was at the 2011 highs.
Taking 2011 by itself, we can see the rapidly erroding percentage at the July 2011 tops just before the sharp decline in July and August.
Of course, we must note that as of this writing both price and the indicator are making new highs since the June bottom, so it is possible for the appearance of weakness to be remedied if the rally continues.
Conclusion: The percentage of stocks above their 200-EMA shows fewer stocks participating in the advance than there were at the 2011 top and the March 2012 top. This is not a healthy condition, and will probably result in a correction fairly soon; however, the market needs to stop going up before it can go down.

