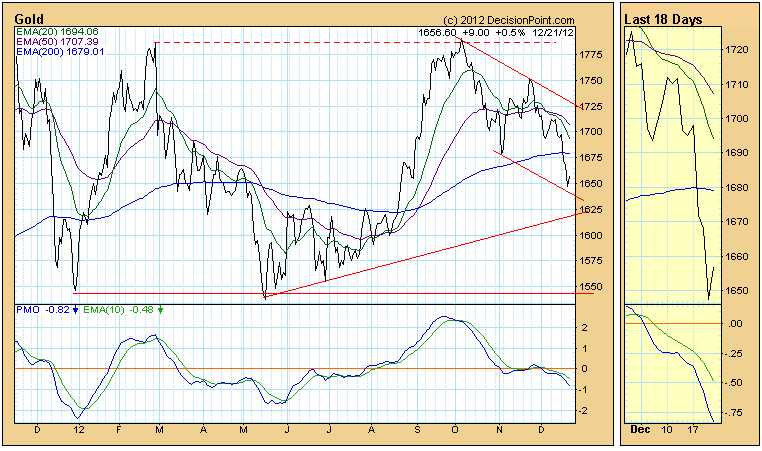
About a month ago I wrote an article stating that I thought that gold was resuming its long-term up trend, but that belief was conditioned upon price moving above the October top. That did not happen. Instead, after putting in a lower top in November, price has dropped below the November low, establishing a three-month down trend.
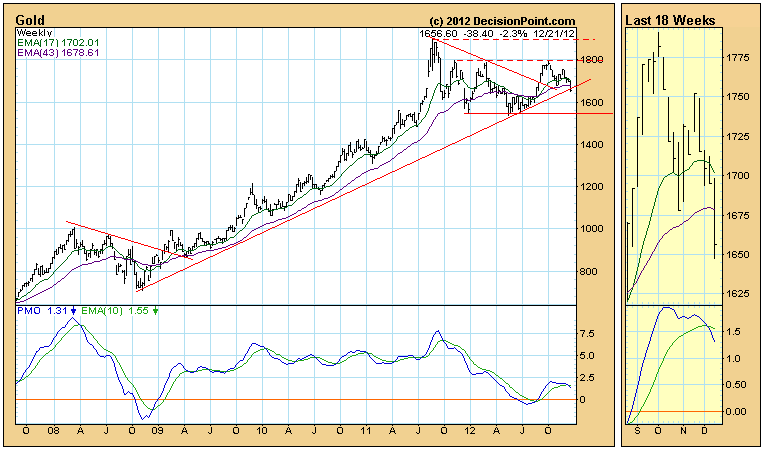
The weekly chart shows that price has dropped below a long-term rising trend line, but I think the trading range (consolidation) between 1540 and 1800 is the dominant feature on the chart. It has held for over a year, and is considered to be a continuation pattern. The technical expectation is that price will head higher once the consolidation is complete. If the bottom of that range is violated, then gold would be in serious technical trouble.
Because of the down trend since October, technical weakness is expressed through the PMOs (Price Momentum Oscillators) in the daily, weekly, and monthly (not shown) time frames, which are below their EMAs and falling. The Trend Model is NEUTRAL, which is appropriate for a trading range.


