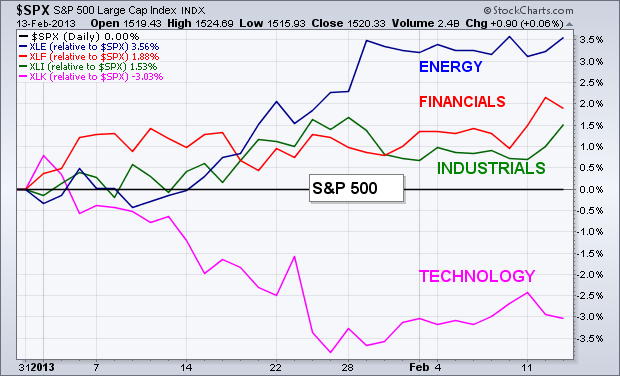
SECTOR LEADERS YEAR TO DATE... Chart 1 plots relative strength ratios of the energy, financial, and industrial sectors versus the S&P 500 (the black zero line). Those three sectors have been the top performers year to date. Technology has been the weakest (on a relative basis). Let's start by taking a closer look at the two top sectors -- energy and financials.
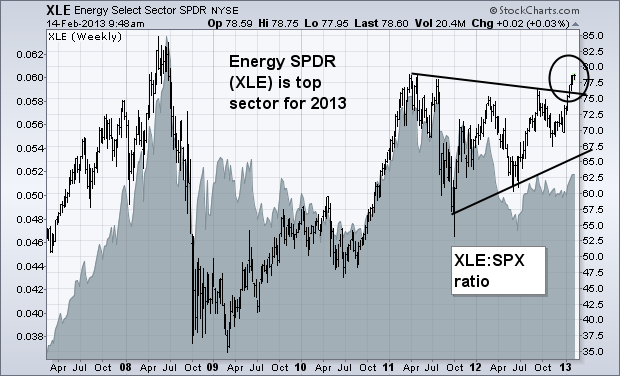
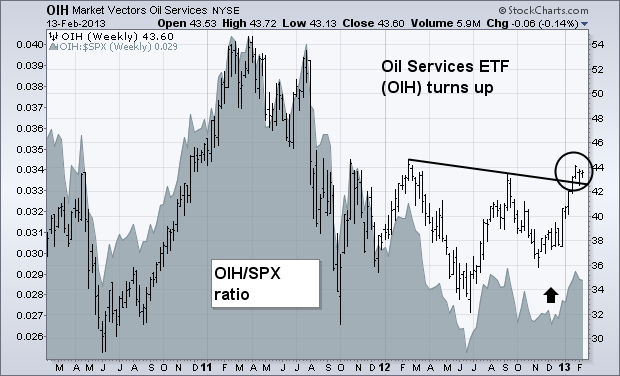
ENERY ETFS ARE BREAKING OUT TO THE UPSIDE... The weekly bars in Chart 2 show the Energy Sector SPDR (XLE) breaking out of a bullish "symmetrical triangle" (see circle). [A symmetrical triangle is defined by two converging trendlines. Since it's a "continuation" pattern (and the prior trend was up), it's a bullish pattern]. The XLE is now challenging its early 2011 high. A rise above that barrier (which appears likely) would pave the way for an eventual rise to its 2008 peak. Its relative strength ratio (gray area) has also turned up during 2013 for the first time in two years. The weekly bars in Chart 3 show the Market Vectors Oil Services ETF (OIH) rising above a "neckline" drawn over its 2012 peaks (circle). Its relative strength line (gray area) has also turned up.
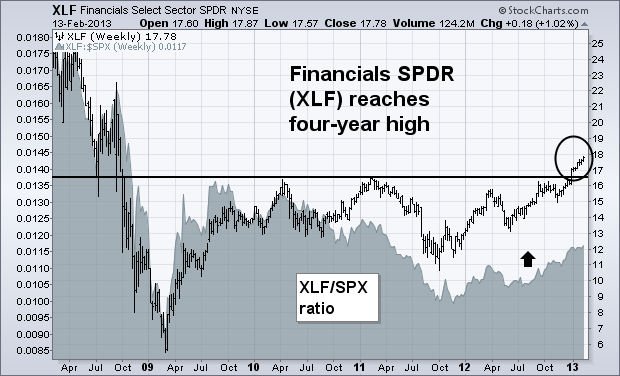
FINANCIALS REACH FOUR-YEAR HIGH... It's usually a good sign for the stock market when financial stocks are in a leadership role and in an uptrend. That's certainly the case on both points. Chart 4 shows the Financials Sector SPDR (XLF) having risen above its 2011 peak to reach the highest level since 2008 (see circle). That represents a major bullish breakout and suggests that the bottoming pattern that started in 2009 has been completed. Its relative strength ratio (gray area) has also been rising and and is now at the highest level in nearly two years. The XLF includes a wide range of financial stocks that include banks, brokers, insurance, financial service companies, and REITS.


