I remain bullish for 2013 and believe we could see 1700-1800 on the S&P 500 before the year is over. But I can't deny the short-term warning signs that are showing up everywhere. Let's take the issues one at a time.
1. Historical Tailwinds Have Ended
Since 1950, the months of November, December and January have been the three best consecutive months for the S&P 500 and have accounted for roughly 50% of all of this benchmark index's gains during this period. That period just ended. Unfortunately, February has carried an annualized return of -1.27% over the past 63 years on the S&P 500, making it the 2nd worst calendar month of the year. Making matters worse, February has an annualized return of 5.02% from the 1st through the 15th, but has an annualized return of -11.47% in February AFTER the 15th. Friday was February 15th.
2. Momentum Has Slowed
We only have long-term momentum issues on a few indices that include biotechs and homebuilders. But shorter-term negative divergences are popping up everywhere. On Friday, I ran a StockCharts scan of POSITIVE divergence candidates and there were 30. I then ran a scan looking for potential NEGATIVE divergences and my scan returned nearly 200. Obviously, momentum is becoming an issue.
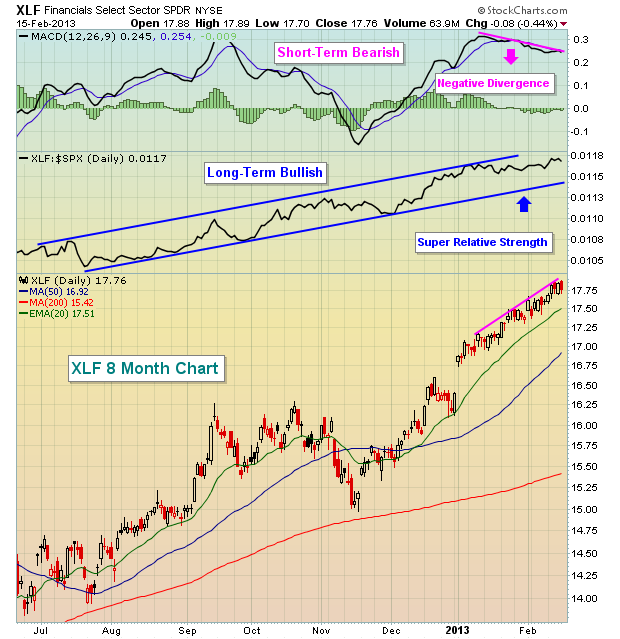
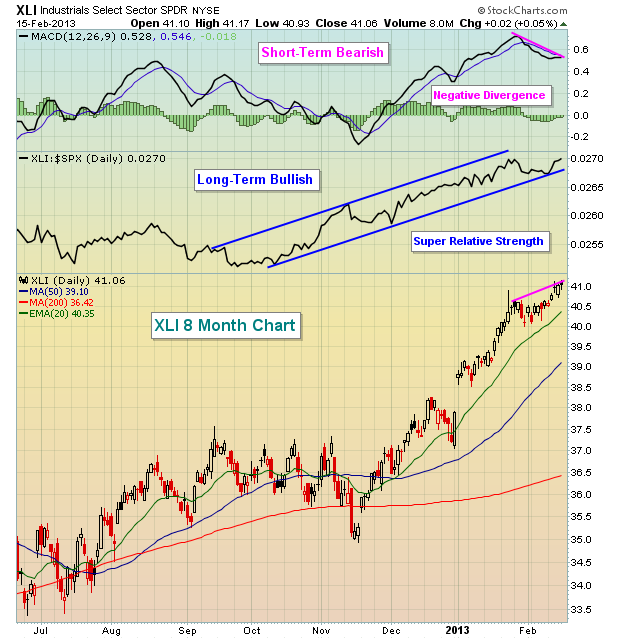
Over the past three months, financials (XLF) and industrials (XLI) have been the relative leaders with gains of 17.73% and 16.77%, respectively. But slowing momentum is already very obvious on both of these daily charts. Check them out:
The move higher has been great. 17% returns in 3 months - it's tough to beat that. Yet both of these leaders are looking like they need a rest. Higher prices with lower MACDs don't guarantee us that a correction is coming, at least not as far as I'm concerned. What they DO tell me, though, is that risks are elevated and that is what technical analysis is all about. Instead of shallow pullbacks to test rising 20 day EMAs, I'm beginning to think we're ready for 50 day SMA tests.
3. The Volatility Index ($VIX) Bottoming?
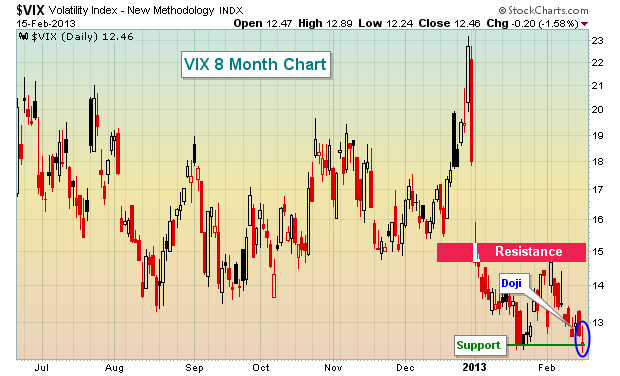
On Friday, the VIX not only tested the January low, signaling perhaps a double bottom, but it also printed a doji candlestick. Dojis are considered reversing candlesticks and it would make sense for the VIX to reverse at the current level. If it does reverse and move higher, it'll likely come at the expense of a declining stock market. You can check out the potential VIX bottom here:
4. The Dollar Rising
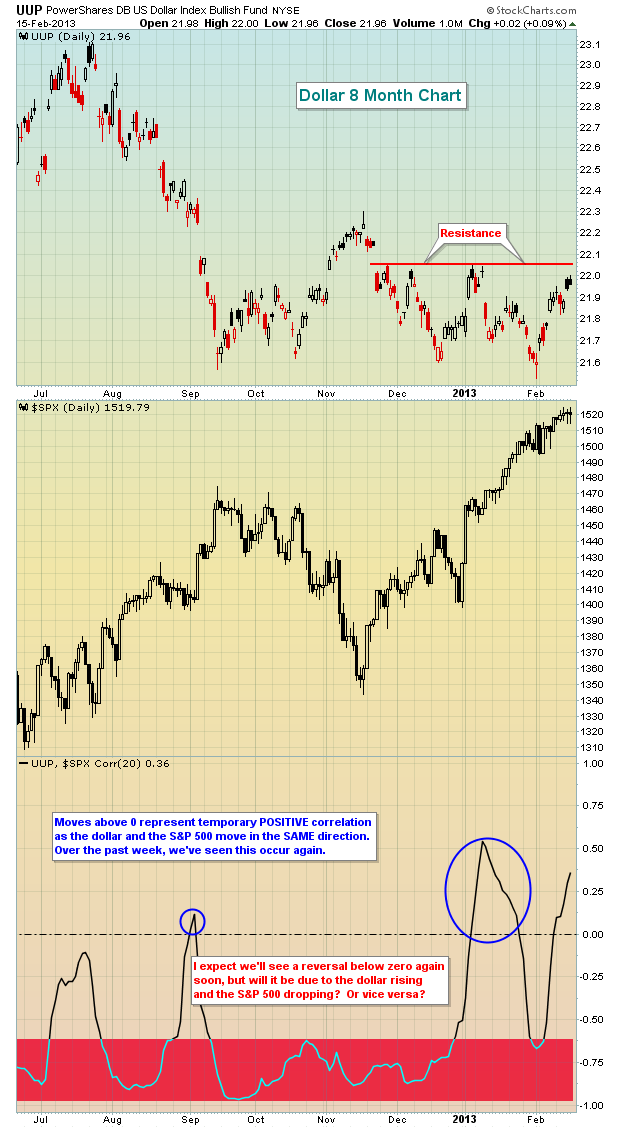
There has been a strong inverse correlation in place for several years between the direction of the U.S. dollar and the direction of the S&P 500. Lately, however, the S&P 500 has attempted to move higher while the dollar also moves up to test resistance. Something has to give here. A breakout in the dollar likely would increase the selling pressure on equities, so as we begin a new trading week, I'd keep an eye on how the dollar trades. Look at the recent POSITIVE correlation:
5. Major Price Resistance
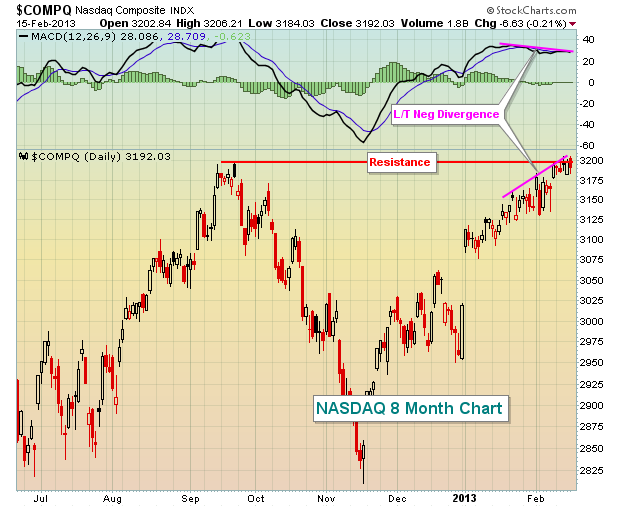
The Dow Jones has been battling the 14000 level for two solid weeks without much success. Just above that psychological price level is the Dow's all-time closing high on October 9th, 2007, of 14164.53. In addition, more recent price resistance resides at 3194.86, which represented the opening price on September 21, 2012 on the NASDAQ. While the NASDAQ was able to clear this level late last week, it's hard to call what it did a "breakout". Check it out:
So, in addition to all of the issues above, throw in significant resistance on two of our major indices.
6. Weak Friday Finish
I realize it's just one day, but our major indices have tended to finish much stronger than they did on Friday. I understand the Dow Jones turned green at the close, but note how both the NASDAQ and Russell 2000 lagged and finished well off earlier intraday highs. In addition, the three top performing sectors on Friday were all the defensive groups. It seems to be that the market is prepping for a pullback sooner rather than later.
Given all the warning signs, I'd avoid most stocks as we head into a holiday-shortened trading week. In particular, there are 5 S&P 500 stocks that look particularly vulnerable to selling this week. CLICK HERE or more details on these stocks.
Happy trading!

