ChartWatchers April 20, 2013 at 09:13 PM
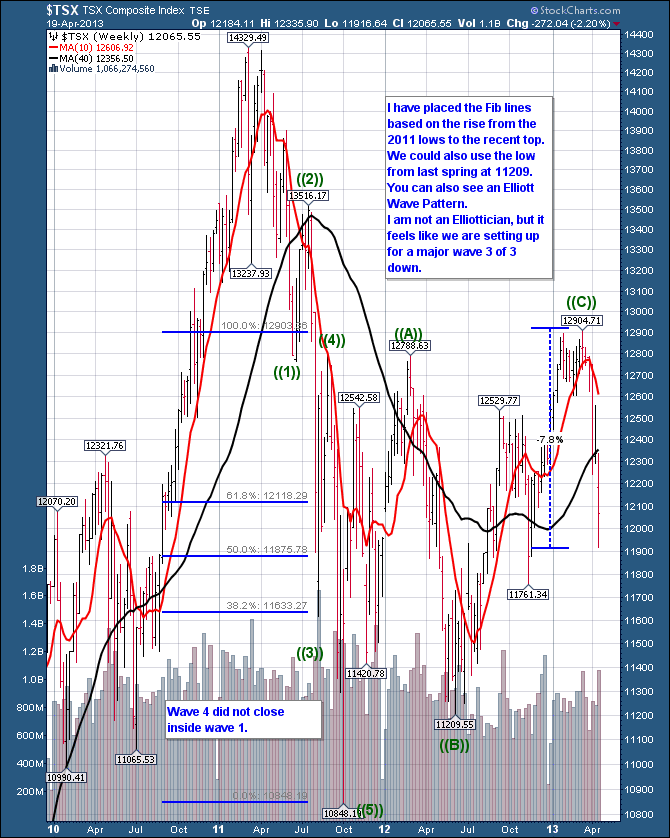
One of the hardest trades to make is the one you don't put on. Just sit. The martial arts practice Defence and Offence. The 40 WMA (Weekly Moving Average) is roughly equivalent to the 200 DMA (Daily). Lets call it the Black belt for today... Read More
ChartWatchers April 20, 2013 at 03:14 PM
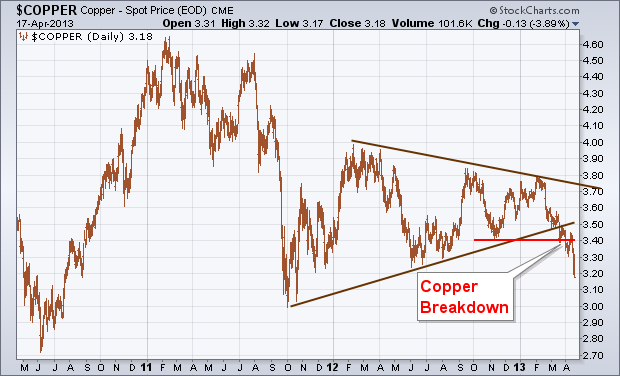
Of all the commodity markets, copper is viewed as the most closely aligned with trends in the global economy. Copper and other commodities have been lagging behind global stocks over the past year (largely owing to a stronger dollar and weakness in Chinese stocks)... Read More
ChartWatchers April 20, 2013 at 02:54 PM
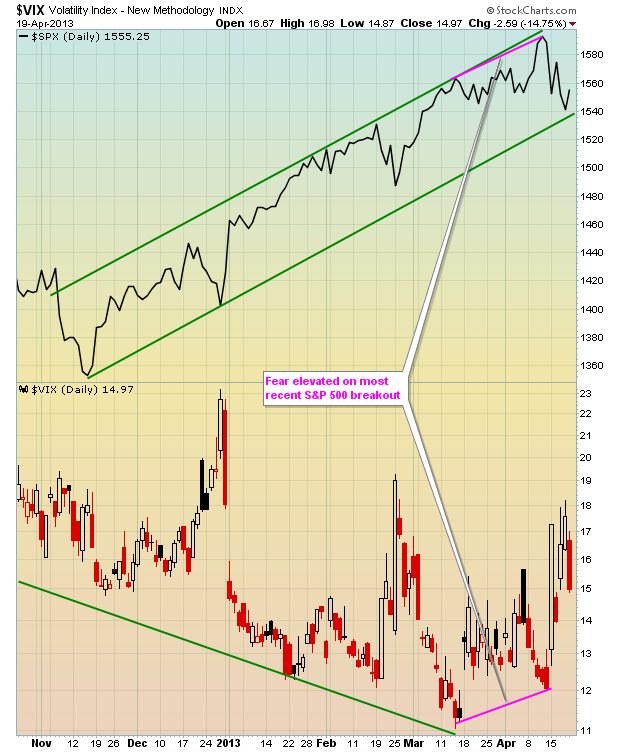
At its highest level last week (Thursday afternoon), the VIX was up 50% from its prior Friday close. That's a HUGE spike in volatility. Volatility, as measured by the CBOE Volatility Index (VIX), provides us a gauge of fear in the stock market... Read More
ChartWatchers April 20, 2013 at 01:27 PM
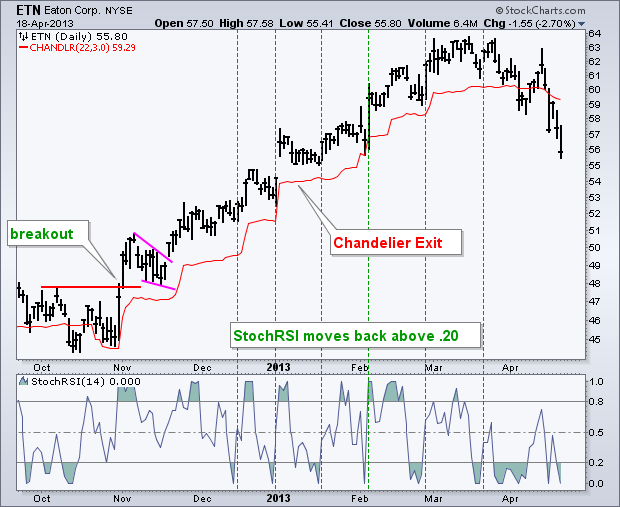
Hello Fellow ChartWatchers! I'm very happy to announce that we've just added a new overlay to our system - the Chandelier Exit. This overlay is a favorite of our good friend Dr. Alexander Elder. He discusses it extensively in his books... Read More
ChartWatchers April 20, 2013 at 01:12 PM
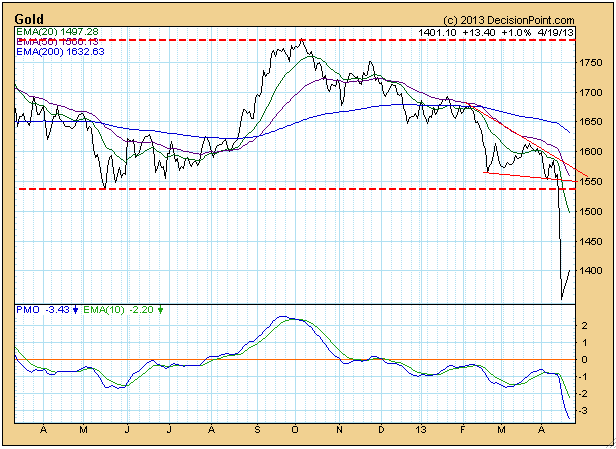
In the last few weeks gold has experienced a major breakdown, and, of course, there are many opinions as to what will happen next. Let's take a broad look at the technicals, so that we have some context for making decisions... Read More
ChartWatchers April 20, 2013 at 01:07 PM
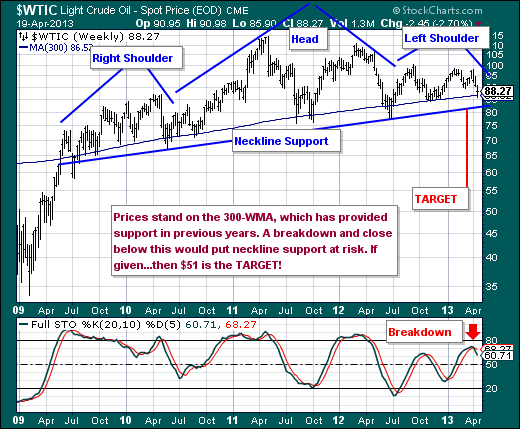
Our attention has turned to the crude oil market, where a rather large "head & shoulders" top pattern is in development. The focus is upon how prices challenge and hold the 300-week moving average, and if not...whether neckline support is violated... Read More
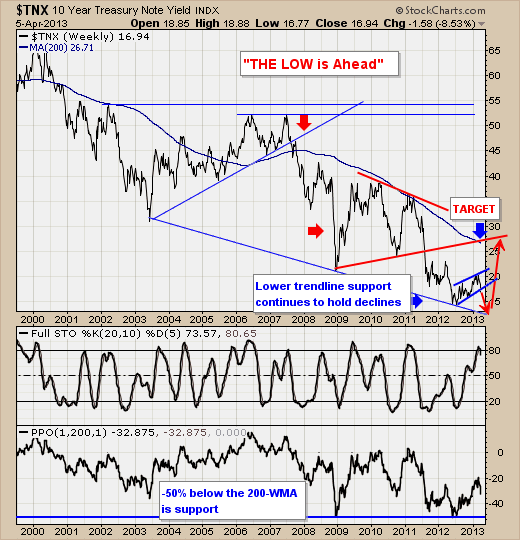
ChartWatchers April 20, 2013 at 08:22 AM
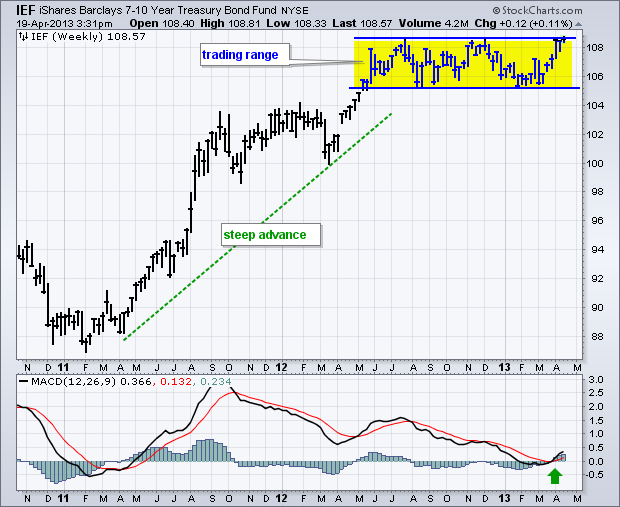
The 7-10 YR Treasury Bond ETF (IEF) is challenging resistance and a breakout would have negative consequences for stocks. Stocks and Treasury bonds are negatively correlated because they march to the beat of different drummers... Read More
ChartWatchers April 07, 2013 at 12:01 AM
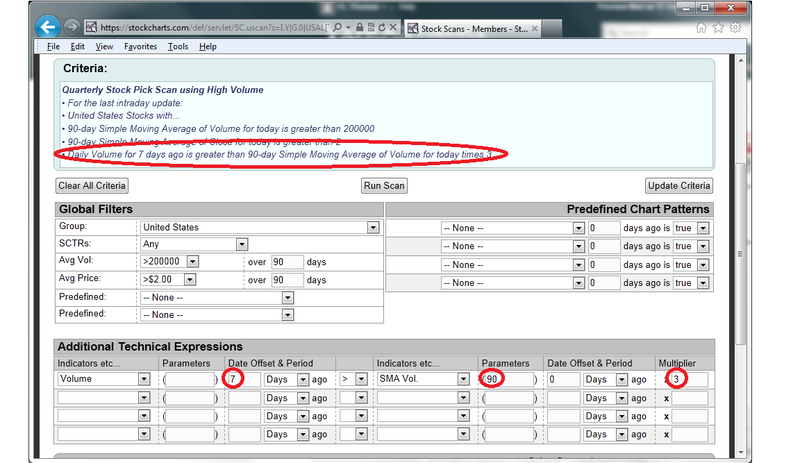
This is my favorite time of the quarter. Being a "technifundamentalist", I like finding companies that look solid both technically and fundamentally and concentrate my trading efforts there. For me, it all begins with volume... Read More
ChartWatchers April 06, 2013 at 10:58 PM
Hello Fellow ChartWatchers! StockCharts continues to grow and expand, providing more value for its users (hey! that's you!) for free. Here are three great improvements we rolled out last week: 1... Read More
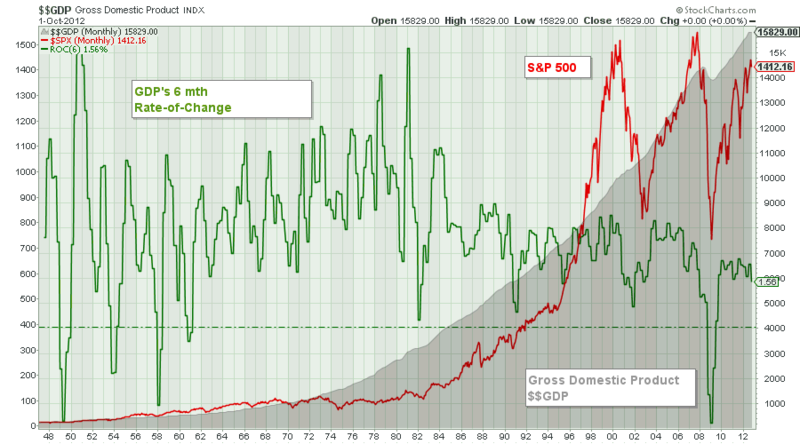
ChartWatchers April 06, 2013 at 04:47 PM
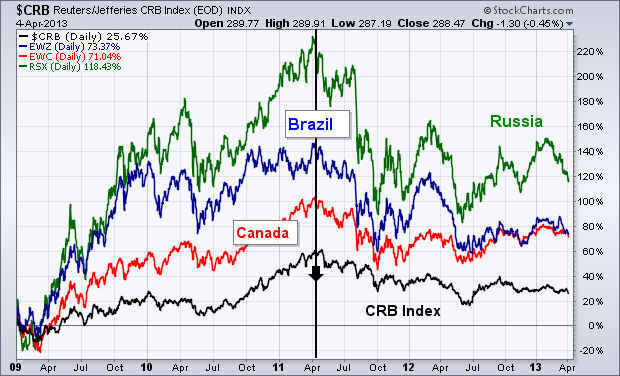
This is the same headline used in my March 21 message which showed how falling commodities were hurting stocks of countries that produced commodities. A rising dollar causes foreign stocks to underperform U.S. stocks, which has been the case since the dollar bottomed during 2008... Read More
ChartWatchers April 06, 2013 at 04:40 PM
April has not thus far been very kind to the economic bulls. The various world and US PMI reports have been "less-than-anticipated", while employment is showing weaker-than-expected figures via the weekly jobless claims, ADP private payroll and non-farm payrolls... Read More
ChartWatchers April 06, 2013 at 04:31 PM
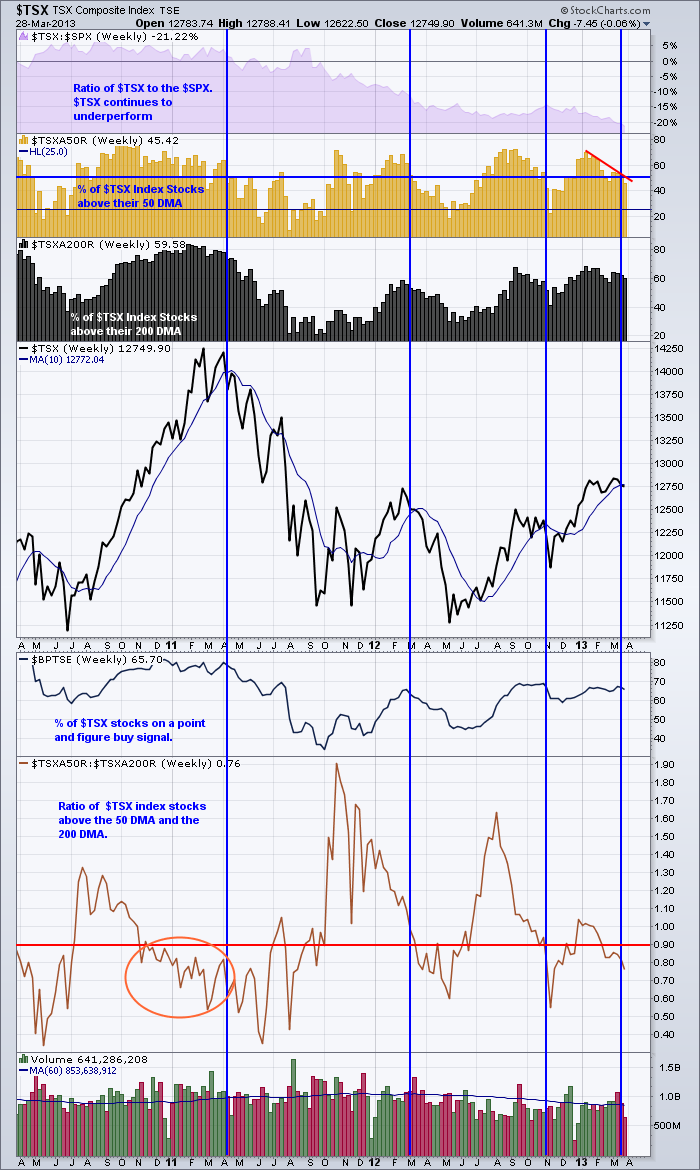
We have a few wonderful indicators we can use to judge the overall health of the market. The problem for the technician is when to say, "I'm Out!" Lets compare the $TSX to the $SPX using these two charts to analyze the broader picture. Here are the links... Read More
ChartWatchers April 06, 2013 at 01:39 PM
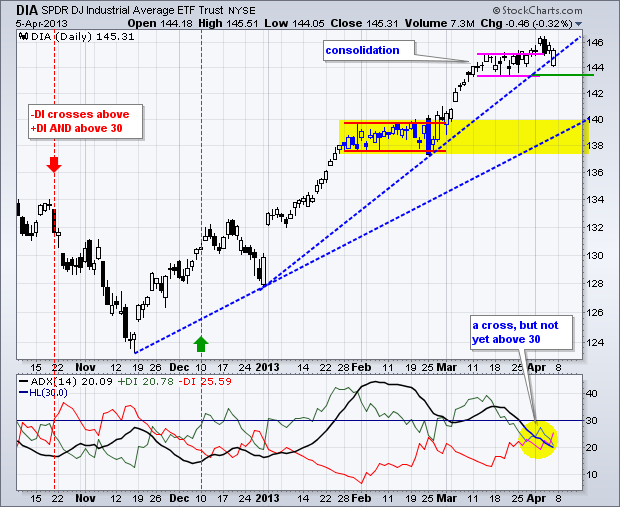
The Directional Movement Indicators have equalized as trading turns flat for the Dow SPDR (DIA), but the overall trend remains up as the ETF tests its first support zone. Let's look at support first... Read More
ChartWatchers April 05, 2013 at 09:12 PM
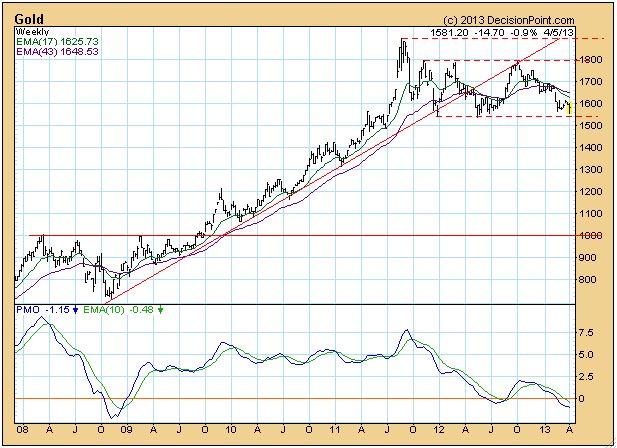
While gold is still maintaining a long-term consolidation, gold mining stocks have signalled still lower prices to come. A quick look at the weekly gold chart shows that the metal is holding above a line of support that goes back over a year... Read More