Hello Fellow ChartWatchers!
As I mentioned last time, we've recently started adding key economic datasets to our database so that you can chart them with our SharpCharts charting tool. This week, we added the weekly Unemployment Indexes including the Initial Jobless Claims number. The symbol for that index is $$UNEMPCIN.
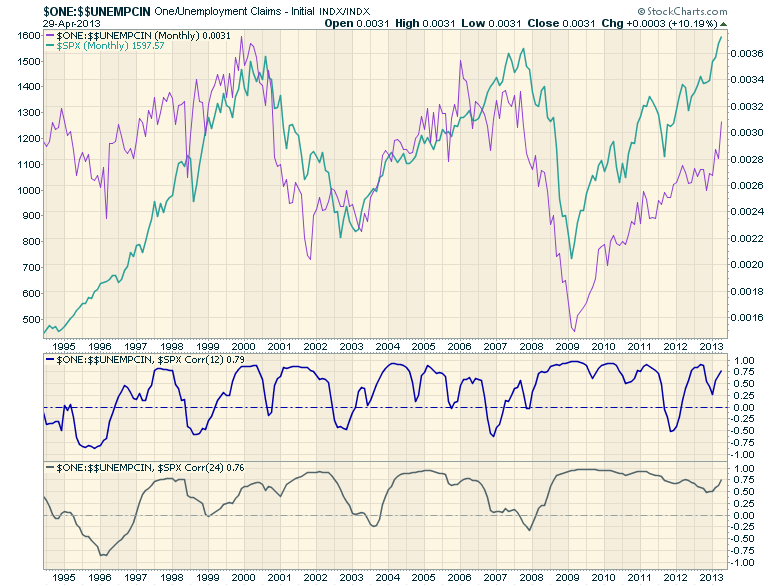
$$UNEMPCIN behaves inversely to the stock market - when the market is doing well, initial jobless claims are falling and vice versa. We can see this directly by charting the inverse index - $ONE:$$UNEMPCIN and overlaying that with the S&P 500. Check out the following chart to see what I mean:
(Click here for a live version of this chart.)
This chart is a monthly line chart. I'm using months instead of weeks to smooth out some of the noisyness of the data.
Now, in addition to the two overlaps price plot lines, I've also added the 12-month Correlation indicator and the 24-month Correlation indicator. As you can see, both of those lines spend most of their time above the zero line in the middle of that plots. That confirms what we can intuitively see - that the red and blue lines move more-or-less in unison (i.e., they are positively correlated).
What's interesting is that points in time where the correlation lines dip below zero. That happens when the red and blue lines start moving in opposite directions. Note that on the 24-month correlation line, those dips correspond with major changes in market direction. Those same signals are on the 12-month Correlation indicator as well, but they aren't quite as easy to pick out. Still, whenever the 12-month Correlation of these two lines dips below zero, it might be time to look for the market to change direction.
- Chip

