That's the bad news. The good news is that momentum issues are more of a short-term nature than a long-term one. Still, as traders, we need to respect them just the same.
First, let's take a look at the benchmark S&P 500 index on a weekly basis (think BIG picture):
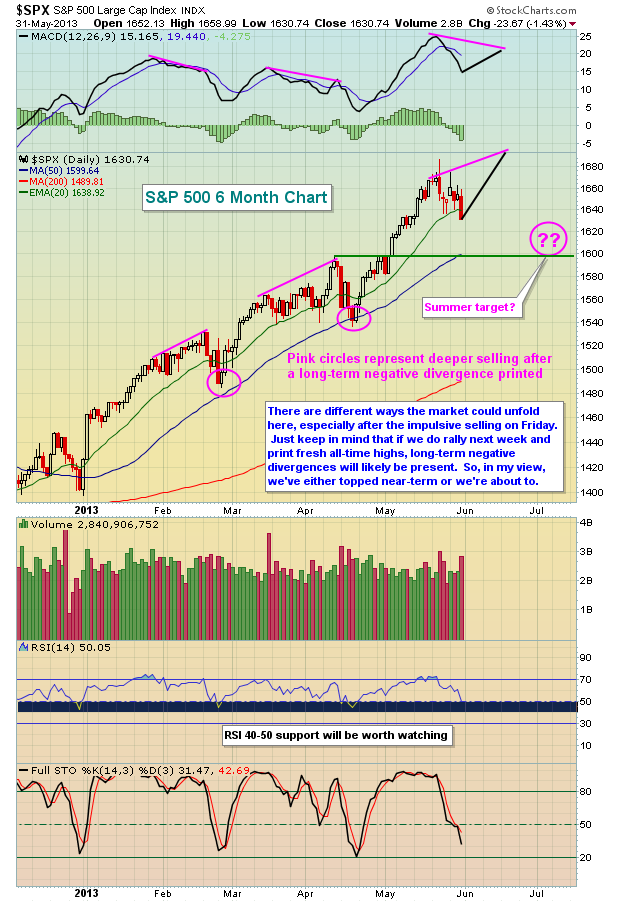
The MACD couldn't be much stronger. As S&P 500 prices have risen to new heights, so too has the weekly MACD. That suggests that the longer-term rally hasn't ended, so keep this in mind during any short-term periods that are more bearish and frustrating. The short-term may prove to be troublesome. While the long-term weekly MACD looks great, that's not the case on the daily MACD. Check out the S&P 500's daily chart and take a look at the hit the MACD has taken lately:
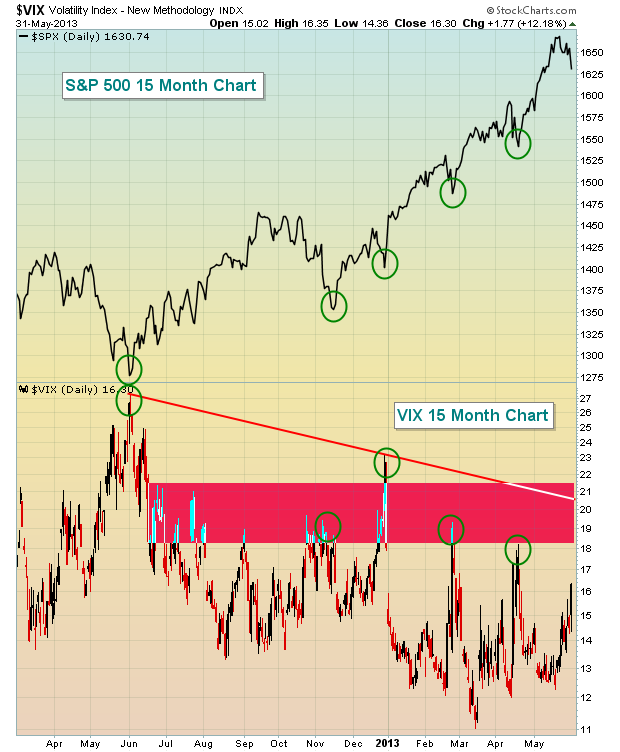
Last week saw a big spike in the Volatility Index ($VIX). Determining where the VIX will top is a big piece of the puzzle in determining where the S&P 500 will bottom. Take a look at this chart of the VIX and note how recent tops have marked short-term bottoms in the S&P 500:
I would look for a top in the VIX in the 18-19 area. If selling really escalates and fear spikes, perhaps we'll see a test of the downtrend line closer to 21. Over the past year, nearly every short-term bottom in the S&P 500 has occurred with a VIX somewhere in the 18-21 range. The late December 2012 period was an anomaly as fiscal cliff talks spooked investors. Once the VIX tops, though, I do expect another rally in equities based on a number of factors, but certainly that strong weekly MACD won't hurt.
I've recorded a video lesson on the MACD and would be happy to share it with anyone interested. CLICK HERE for details.
- Tom


