ChartWatchers December 22, 2013 at 05:22 AM
Hello Fellow ChartWatchers! Well, 2013 is almost over - this is the last ChartWatchers newsletter until 2014 - and I thought now would be a good time to review some of the key technical developments during the past year... Read More
ChartWatchers December 21, 2013 at 09:30 PM
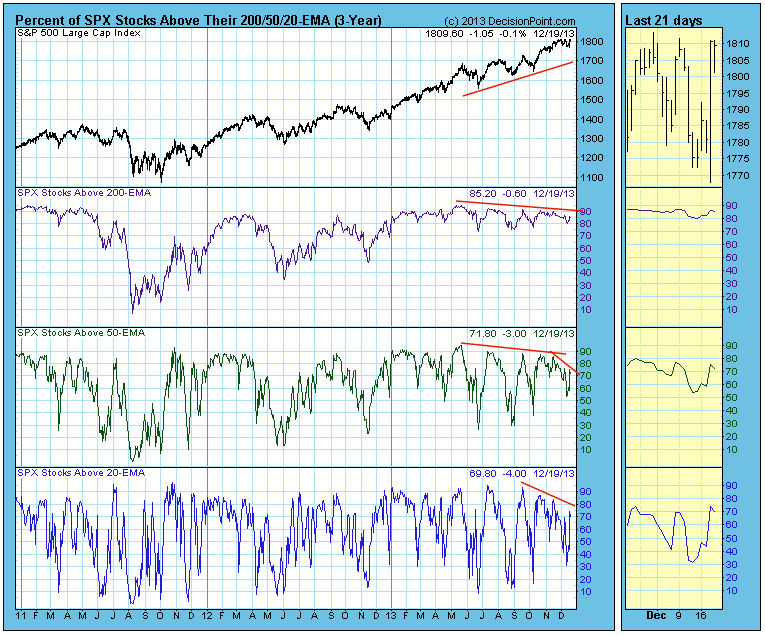
When a stock is above a moving average it is considered bullish, and the stock can be considered to be in a rising trend for that time frame... Read More
ChartWatchers December 21, 2013 at 09:27 PM
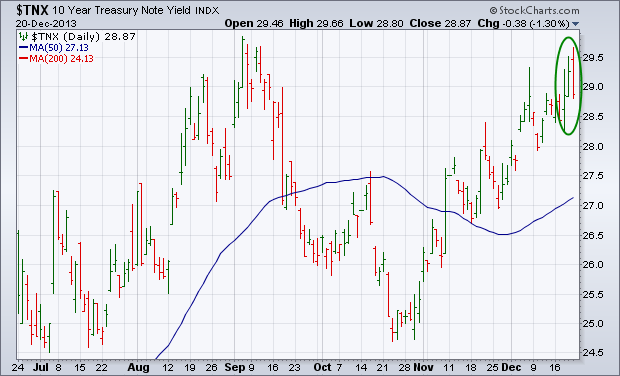
Wednesday's Fed announcement that it would finally begin a modest tapering of bond purchases in January gave a slight boost to bond yields during the second half of the week... Read More
ChartWatchers December 21, 2013 at 09:24 PM
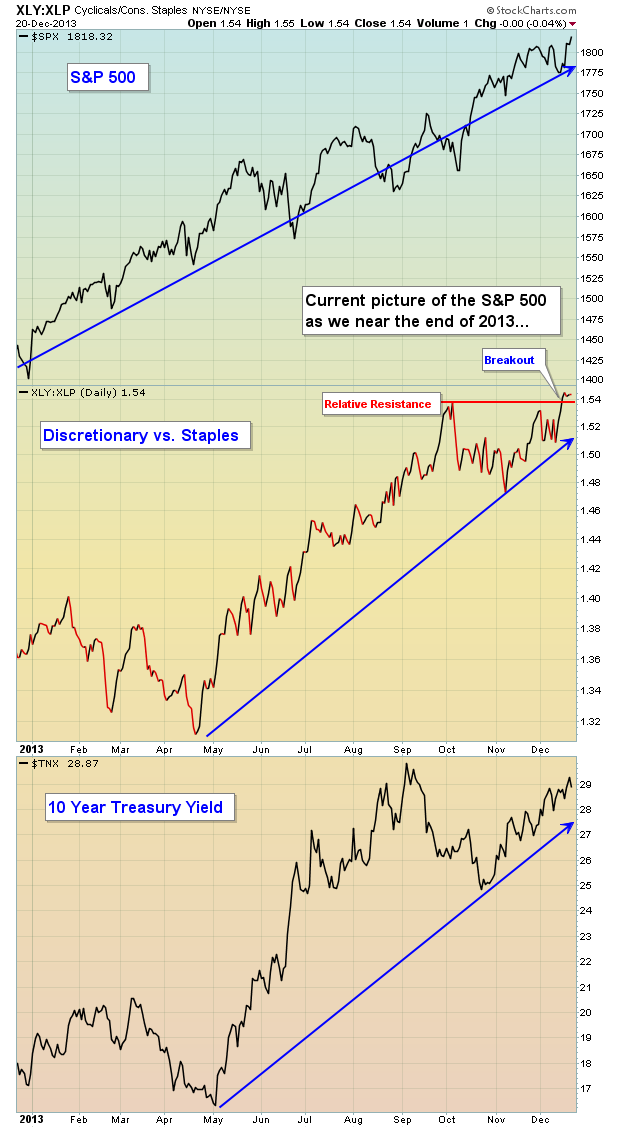
It's quite easy to look at the S&P 500 and see if it's rallying or not. But not every rally is created equal. Many rallies carry significant warning signs that should have you running for cover. Others simply invite you to jump on the train... Read More
ChartWatchers December 21, 2013 at 11:39 AM
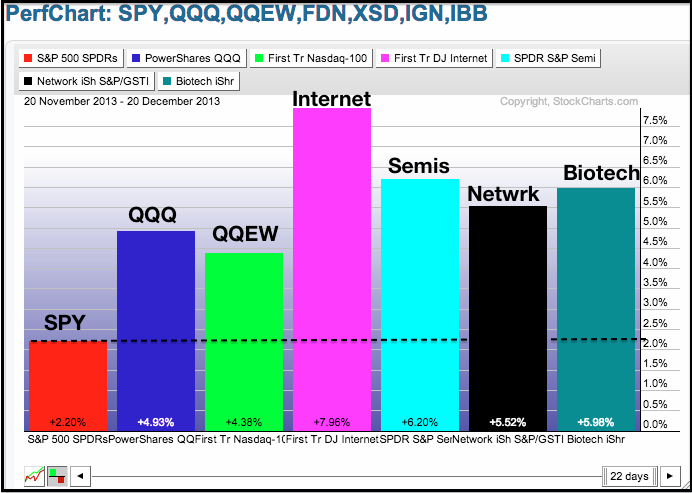
Key industry group ETFs within the technology sector are leading the market. This shows a healthy appetite for risk and bodes well for the economy. The PerfChart below shows one-month performance for the S&P 500 ETF (SPY) and six tech-related ETFs... Read More
ChartWatchers December 08, 2013 at 01:27 PM
Hello Fellow ChartWatchers! Happy Holidays and Merry Christmas to you and yours from your good friends at StockCharts! I have several important announcements I'm dying to tell you about but first a quick reminder that John, Arthur, Greg, Carl, Richard and Tom are all have article... Read More
ChartWatchers December 07, 2013 at 08:24 PM
When I map out my trading strategies, I consider fundamentals, especially quarterly earnings reports, but I FOCUS on technical indicators. The study of price action helps to determine future price action, but note that it doesn't guarantee it... Read More
ChartWatchers December 07, 2013 at 08:17 PM
In the fundamental economic forum, the balance of economic data has been "positive" as of late with the exception of the housing market... Read More
ChartWatchers December 07, 2013 at 08:07 PM
Friday's announcement that U.S. payrolls rose by 203,000 during November with the unemployment rate falling to 7% (the lowest level in five years) topped a week of encouraging economic news... Read More
ChartWatchers December 07, 2013 at 03:13 PM
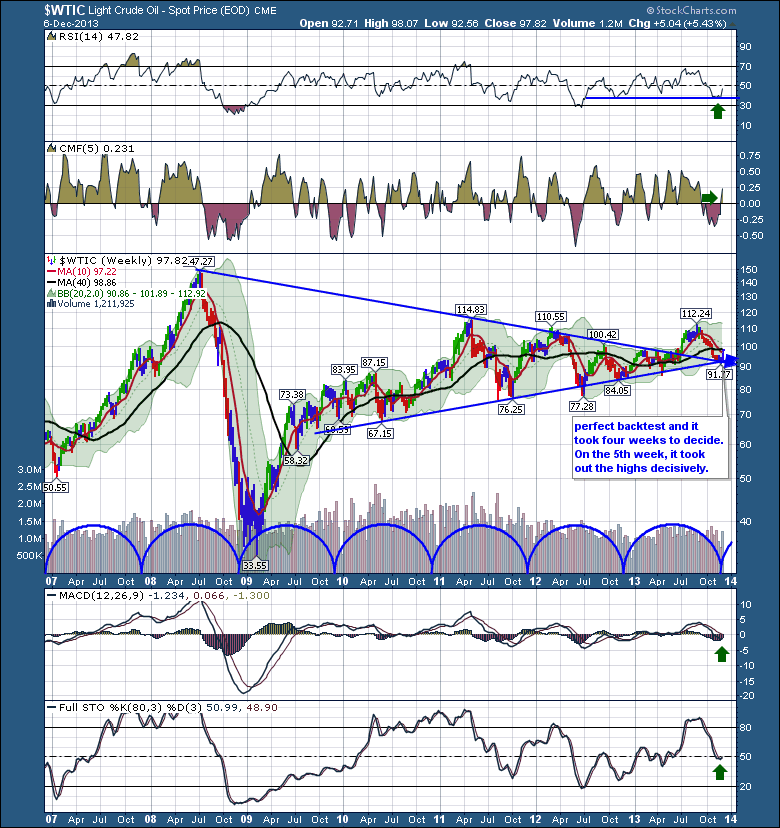
In the forest of information, sometimes the trends don't jump out easily. Rolling through my dashboard charts, I noticed the energy group was on a real roll for the last month. First of all, the big picture in crude oil is at technicians dream time and price... Read More
ChartWatchers December 07, 2013 at 03:07 PM
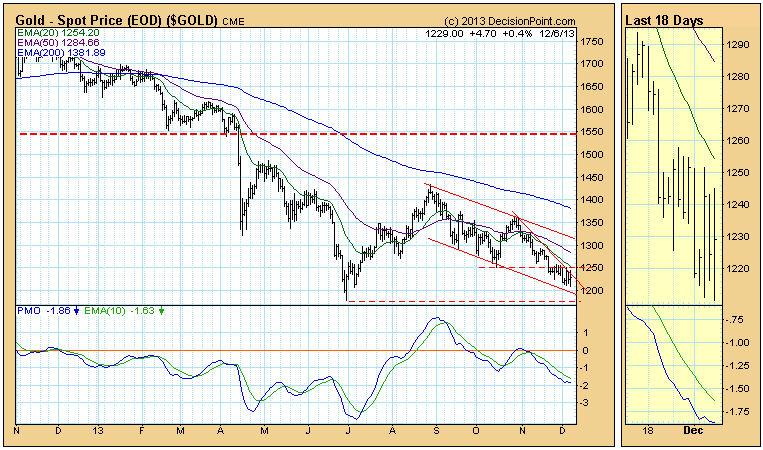
After making a bear market low in June, gold rallied about 20%. Then from the August top, price headed back down for a possible retest of the June low... Read More
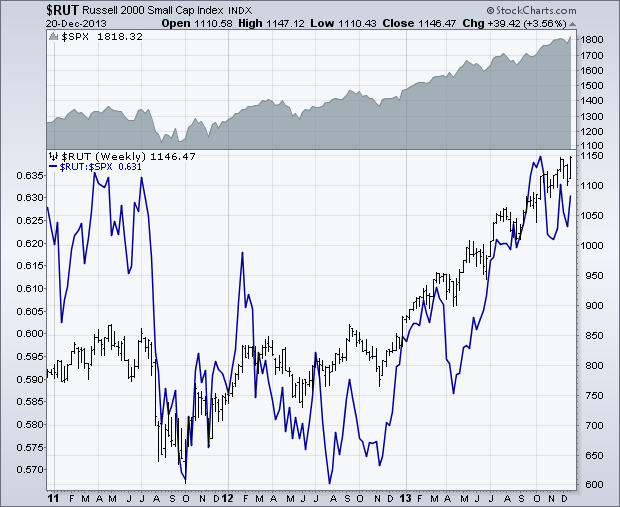
ChartWatchers December 07, 2013 at 04:26 AM
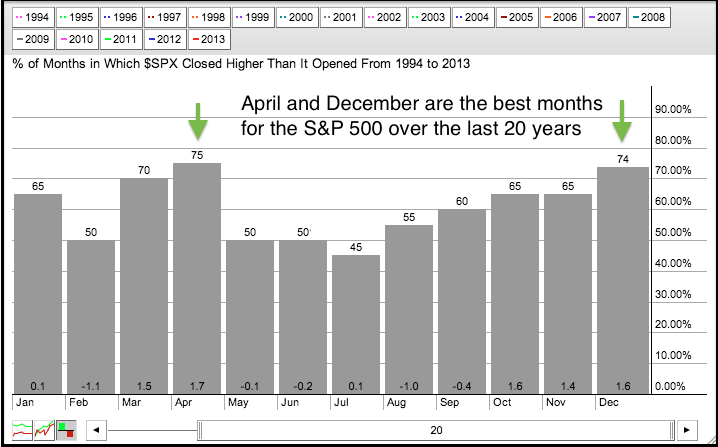
The "January effect" refers to the propensity for stocks to outperform in January and for small-caps to outperform large-caps in January. According to this theory, stocks tend to rise more in January than most other months and small-caps tend to rise even more... Read More