ChartWatchers March 30, 2014 at 07:42 PM
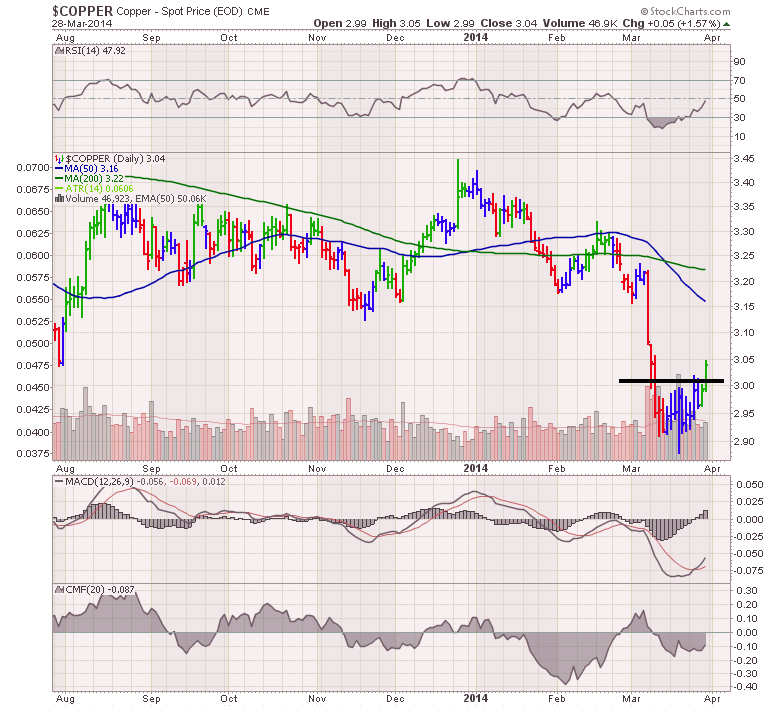
Dr. $COPPER made a big pullback below support. In the last day it surged above resistance. This may have more to bounce. Two major resource indicators turned up recently. The first I have been watching for a while, the Aussie Dollar... Read More
ChartWatchers March 29, 2014 at 03:22 AM
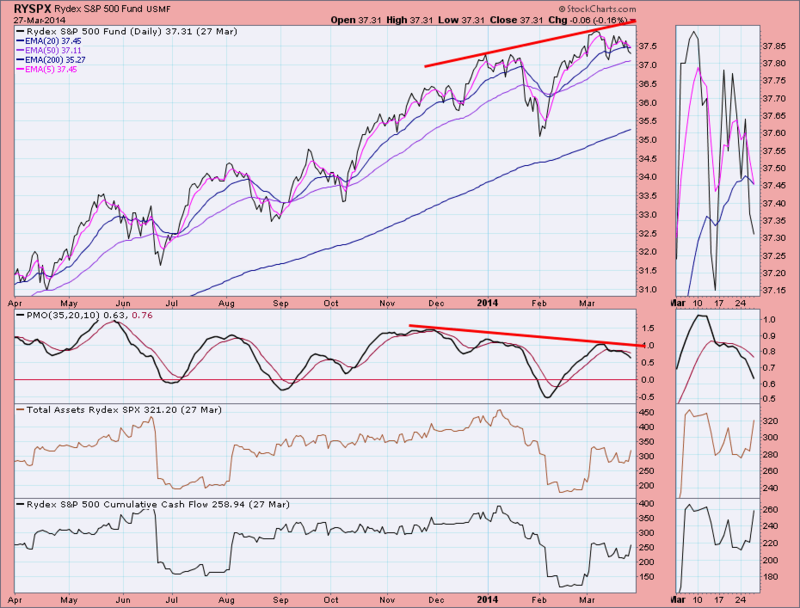
I noticed a number of PMO negative divergences appearing on the Rydex Funds while clicking through the assets and cashflow charts in the DecisionPoint Rydex ChartPack... Read More
ChartWatchers March 16, 2014 at 06:12 AM
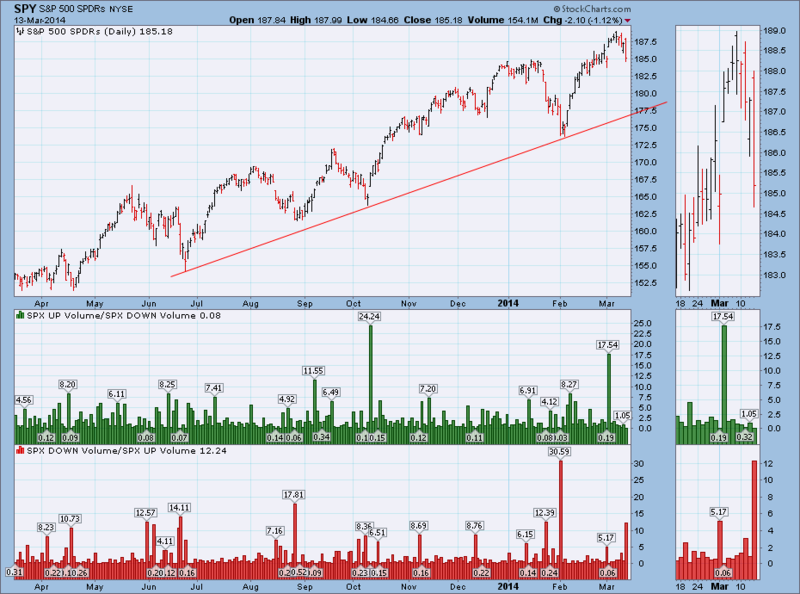
In his book "Winning on Wall Street", the late Marty Zweig showed us the value of volume ratios. A ratio of 9:1 or greater of up/down volume is considered to be very bullish and 9:1 down/up volume is considered to be very bearish. We certainly met the bearish threshold today... Read More
ChartWatchers March 15, 2014 at 03:44 PM
Nope, I'm not referring to college basketball. Instead, it's this wacky stock market. In my last article, I discussed several reasons why the 2014 advance is on shaky ground. Since then, we've seen increased volatility and lots of whipsaw action... Read More
ChartWatchers March 15, 2014 at 03:33 PM
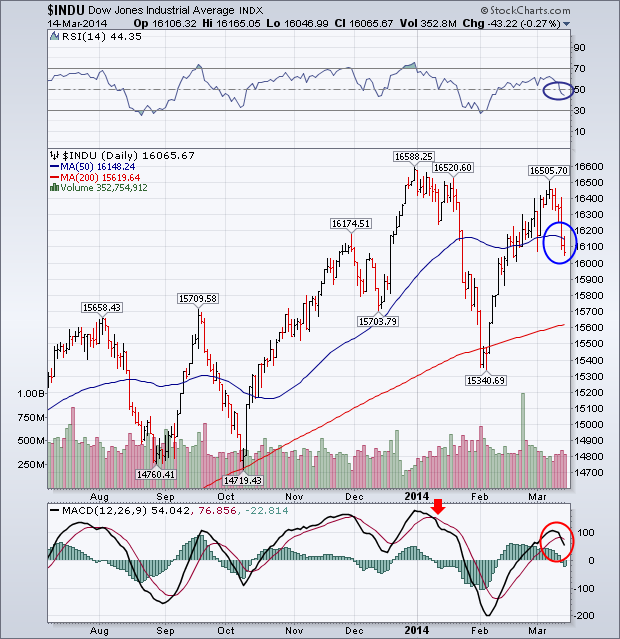
My Wednesday message warned that the Dow Industrials could run into profit-taking near its January highs, and that weekly indicators for the S&P 500 were giving "negative divergences" which also warned of a market pullback... Read More
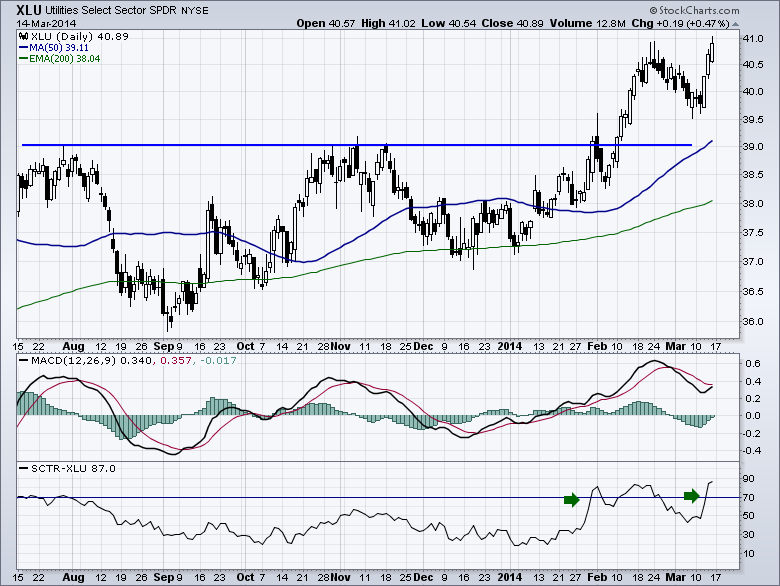
ChartWatchers March 15, 2014 at 03:24 PM
Hello Fellow ChartWatchers! There's been a sea-change in the markets with the recent uncertainty about Russia and the Ukraine. Almost instantly the bullishness on the Sector Rotation charts turned into bearish concern with defensive sectors like Utilities taking off... Read More
ChartWatchers March 15, 2014 at 12:54 PM
This week, the market moved down every day. Wednesday spent the entire day below Tuesday's close except for the last few minutes. That does make a short term trend, again a short term trend... Read More
ChartWatchers March 15, 2014 at 12:49 PM
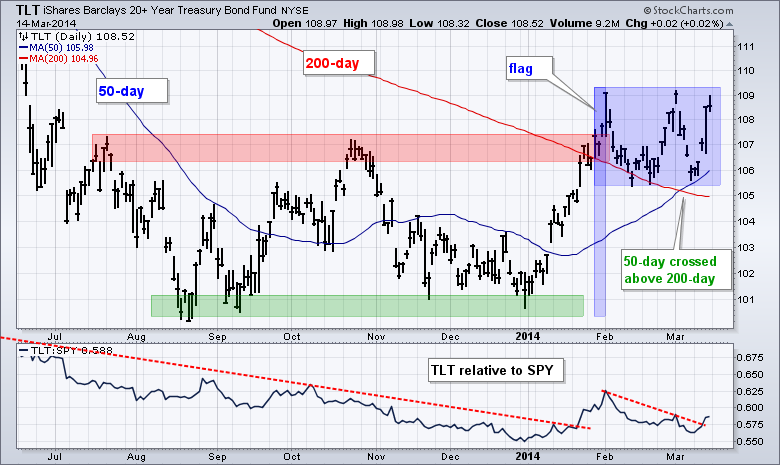
Stocks and bonds have been inversely correlated for most of the last four years, which means they tend to move in opposite directions. This inverse correlation showed up in January as stocks swooned and Treasuries surged... Read More
ChartWatchers March 02, 2014 at 02:09 AM
Hello Fellow ChartWatchers! Last year, I had an article dedicated to things that many people didn't know about StockCharts.com. The list was based on our customer support questions and the feedback we get from our live seminars... Read More
ChartWatchers March 01, 2014 at 08:32 PM
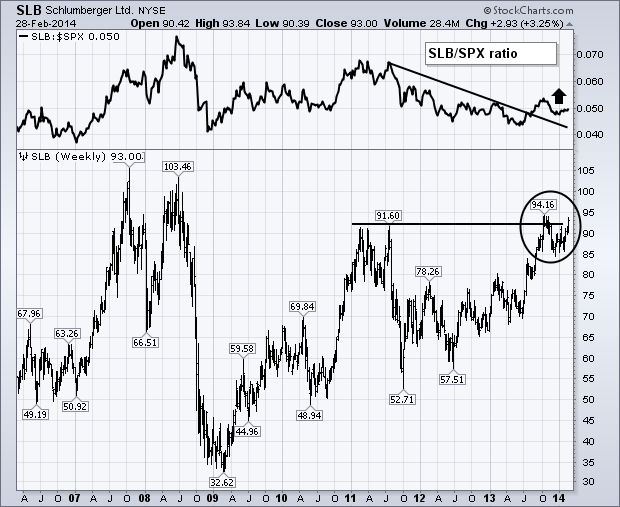
The two biggest stocks in the OIH also happen to be two of the strongest. The weekly bars in Chart 4 show Schlumberger (SLB) nearing a test of its fourth quarter high near 94. A close above that level would put the oil service leader at the highest level in six years... Read More
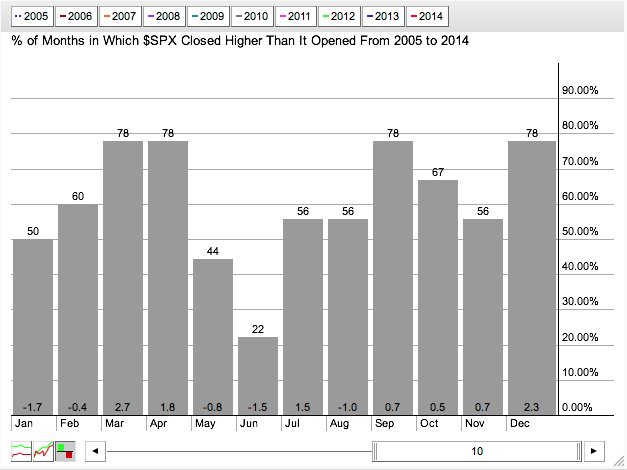
ChartWatchers March 01, 2014 at 08:17 PM

Make no mistake about it, I prefer to be bullish. History supports this notion because the stock market has always tended to move higher more than it moves lower. Dating back to 1950, the S&P 500 has moved higher over 53% of trading days... Read More
ChartWatchers March 01, 2014 at 03:09 PM
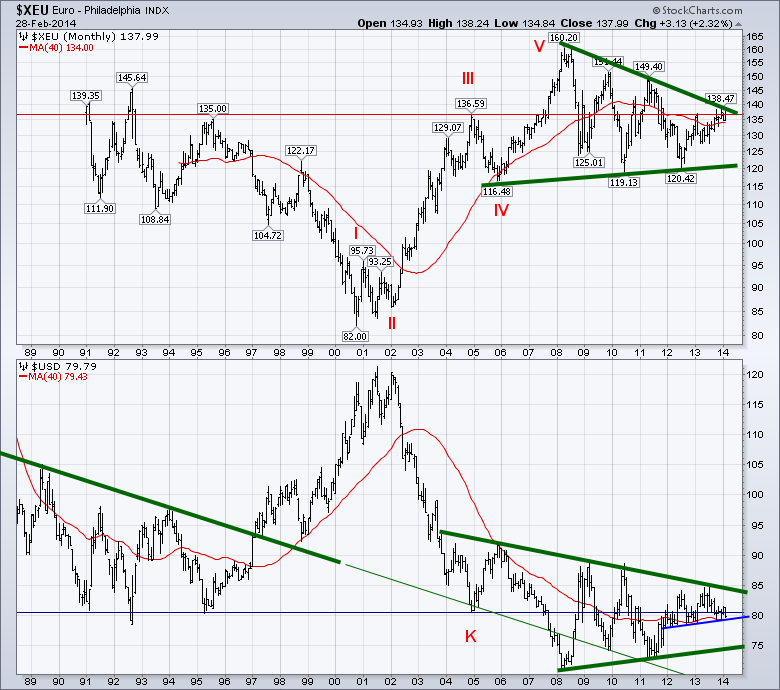
The Euro made a startling move higher on Friday. Rather than get into the daily perspective, I wanted to take a minute to look at the long term view of both the Euro and the Dollar Index... Read More
ChartWatchers March 01, 2014 at 10:57 AM
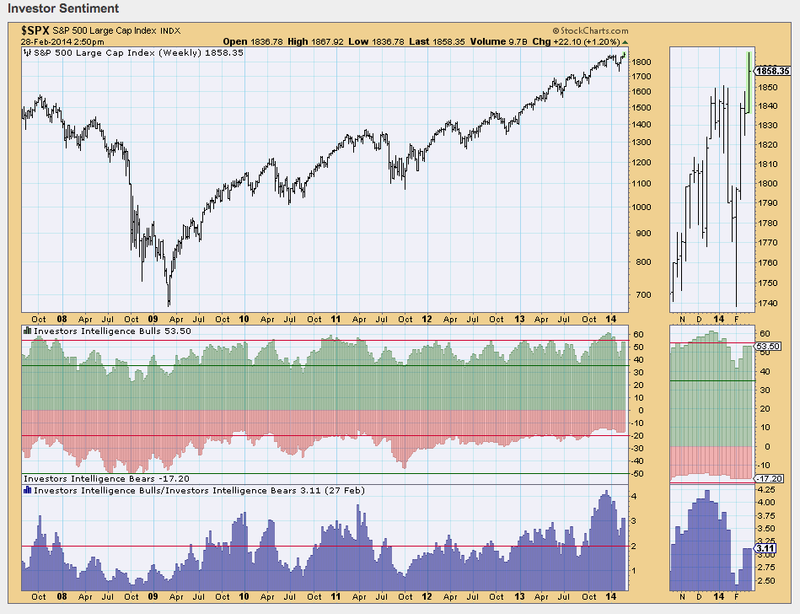
The bulls had been dropping out of the ring during the recent correction, but they're baaaaack. The DecisionPoint Chart Gallery has a section devoted to sentiment... Read More
ChartWatchers March 01, 2014 at 07:47 AM
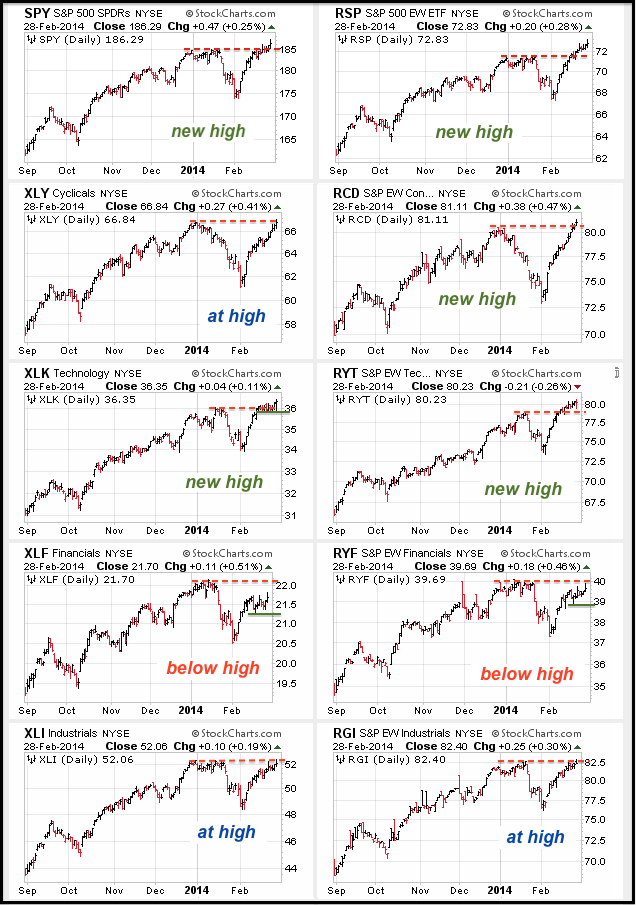
The market can be divided into nine sectors using the S&P Sector SPDRs and the Rydex Equal-weight Sector ETFs. These sectors can be subsequently divided into three groups: offensive, defensive and other... Read More