In earlier 2014 articles, I've discussed warning signs that emerged from Volatility indices, behavior in the treasury market, relative weakness of banks and relative strength of defensive areas of the market like utilities and REITs. In addition, the S&P 500 has shown a propensity to struggle during calendar years in which it shows January weakness - and we were very weak in January 2014.
Well, let's add a couple more concerns to this list - one a short-term concern, the other longer-term in nature.
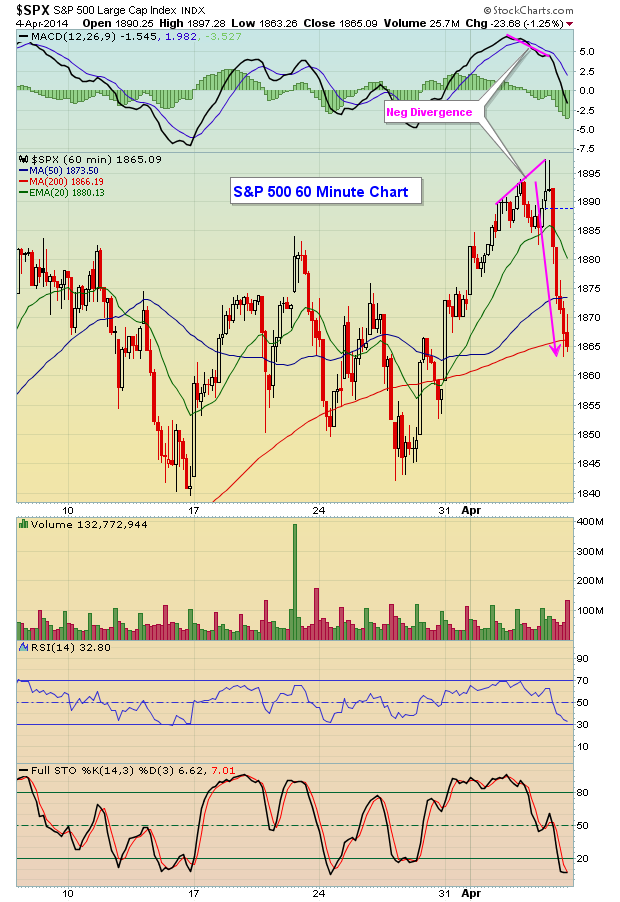
The short-term concern relates to the 60 minute negative divergence that emerged on the S&P 500 as it pushed to an all-time high on Friday morning. Check out this sign of slowing momentum just before the afternoon collapse on Friday:
The Dow Jones is not pictured here, but it too had a negative divergence appear on Friday morning as it was challenging major price resistance of 16577 (all-time high close from late 2013).
These are short-term issues. Now for the more troubling problem.
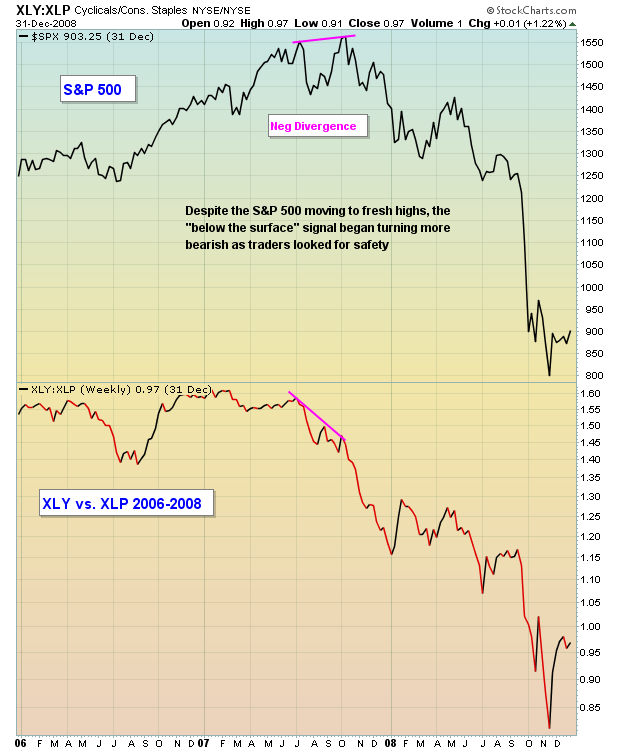
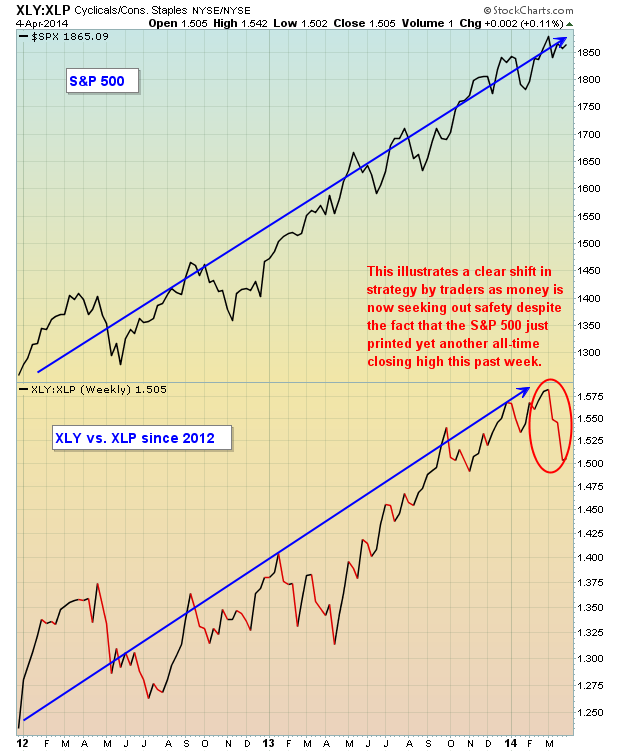
In the consumer area, money has been rotating away from cyclicals and moving into staples. That's a sign of overall market weakness as traders scurry to find safer alternatives. In a bull market, the ratio of cyclicals to staples (XLY:XLP) normally pushes higher as the S&P 500 breaks out. This indicates that traders remain in "risk on: mode and adds to the sustainability of a rally.
Before we look at the current state of consumer stocks, let's rewind back to 2007, just before the last bear market. Check out how the shift in consumer stocks then was a precursor to market weakness ahead:
Now fast forward back to where we are today. The S&P 500 just printed a fresh all-time closing high this past week, but the relationship between consumer stocks sent a very strong message to those watching. Money over the past 4-5 weeks has shifted considerably towards the safer consumer staples (XLP) group. In a bull market, we usually see the opposite. Sustainable bull market rallies are accompanied by a strengthening cyclical group (XLY), but that's not the case now. See for yourself:
We all have to recognize the changes that have been taking place below the surface of what appears to be a raging bull market. If you simply listen to CNBC, you'll approach the market the same as you have since the start of this five year bull market. But conditions are changing, highlighting the added risk of remaining long equities.
Next Saturday, I plan to discuss some of these market conditions in a 3 hour webinar, in addition to illustrating how finding the best stock candidates using the StockCharts scan engine - on both the long and short side - can benefit your trading results. For more information on this event, CLICK HERE.
Happy trading!
Tom Bowley
Chief Market Strategist/Chief Equity Strategist
Invested Central/EarningsBeats.com


