Our focus is so often on the short term, but an awareness of what is happening longer-term is essential to getting a complete sense of market condition. One useful long-term indicator is what we call the 1% EMA of the Advance-Decline Ratio. I first learned of this indicator from Stan Weinstein's 1989 book, Secrets for Profiting in Bull and Bear Markets. He used a 200-day simple moving average of net breadth and called it the Momentum Indicator. When I started tracking it, I found it much easier to use an 0.01 exponential average (200-SMA equivalent).
Simple buy and sell signals are generated when the 1% Index (the choppy amber line) crosses above and below the zero line, but you can see it is pretty active and not so useful in that regard. Several weeks ago I was looking at it and decided to try a 50EMA (the black line overlay) of the index. That makes a lot more sense, actually conveys information more clearly, and while there are still some false signals, it is much more stable. While 50EMA zero line crossovers are clear declarations that momentum has shifted, I think that overbought tops and oversold bottoms give us a head start on looking for price to begin a change in direction.
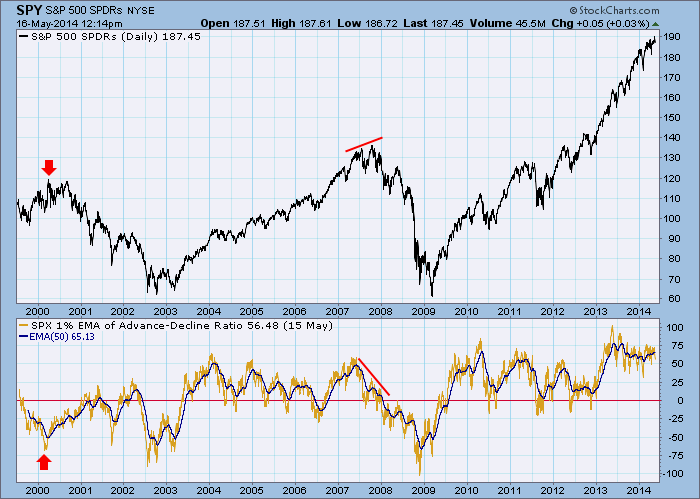
Let's look at three features that stand out. First, on the far left of the chart as the market was making the 2000 bull market top, the 50EMA was already well below the zero line. This was because participation in the bull market had been narrowed to only large-cap stocks, and breath and price were completely out of gear. This is an example of why I consider breadth-based indicators to be secondary to price-based indicators. At any rate, it was certainly confusing, but we could see that there was something seriously wrong with the market at that time.
Next, there was that classic negative divergence at the 2007 top, which was eventually followed by a timely cross down through the zero line. This was about as close to 'textbook' as it could be.
Finally, there is the current configuration with the 50EMA hovering near its highest levels ever. It shows that participation in the rally is vast and confirms what price is doing, but it can't last forever. What I will be looking for at this point is for the 50EMA to break down below about +50. I'm not saying that it is necessarily going to happen soon, but, when it does, it will be an early warning of internal weakness, or even a confirmation of a price correction.
-- Carl Swenlin
(P.S. Click here for a bonus DecisionPoint article from Erin Heim that tells you everything you need to know about the new DP Trackers area.)
