ChartWatchers

Nasdaq and Russell 2000 Charts Turn Positive

John Murphy

John Murphy

Chief Technical Analyst, StockCharts.com

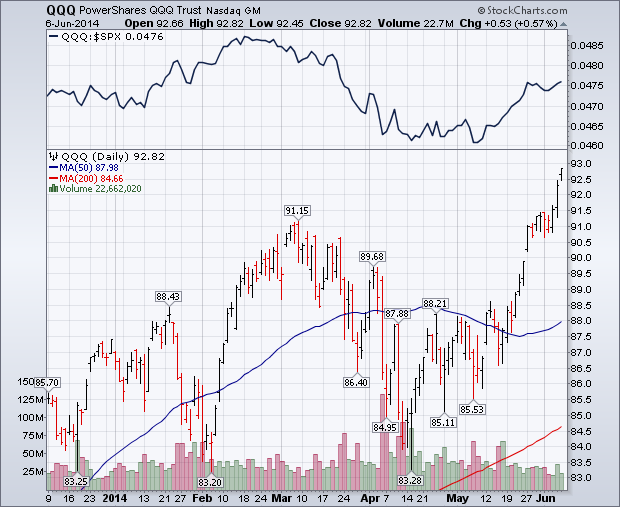
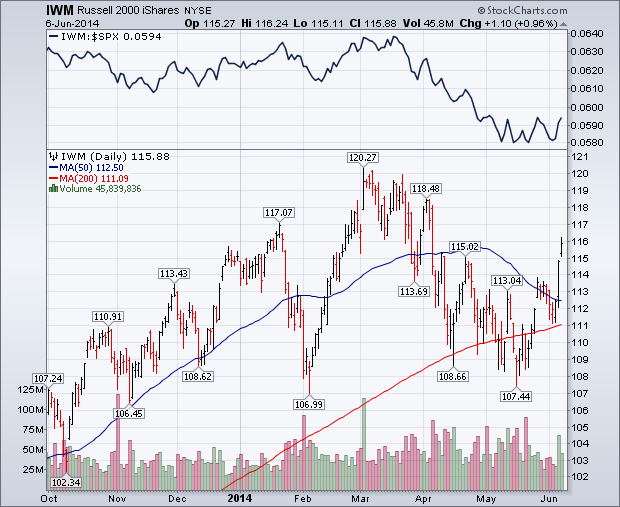
This week's strong chart action in the Nasdaq market and small caps has lent more support to large cap stock indexes that have been setting new record highs. Chart 1 shows Powershares QQQ Trust breaking out to a new recovery high this week. Its relative strength ratio (above chart) has also been rising. Relative weakness in the Nasdaq between February and April had been one of the drags on the rest of the market. The same is true of small caps. Chart 2 shows Russell 2000 iShares (IWM) climbing to a two-month high and ending well above its 50-day moving average. Small caps actually did better than large caps during the week. That's reflected in its relative strength ratio (top of Chart 2) which bounced this week. The RUT/SPX ratio has been stabilizing over the last month after falling sharply from March to May.

John Murphy
About the author: is the Chief Technical Analyst at StockCharts.com, a renowned author in the investment field and a former technical analyst for CNBC, and is considered the father of inter-market technical analysis. With over 40 years of market experience, he is the author of numerous popular works including “Technical Analysis of the Financial Markets” and “Trading with Intermarket Analysis”. Before joining StockCharts, John was the technical analyst for CNBC-TV for seven years on the popular show Tech Talk, and has authored three best-selling books on the subject: Technical Analysis of the Financial Markets, Trading with Intermarket Analysis and The Visual Investor. Learn More