Hello Fellow ChartWatchers!
Small Caps have been on a tear recently - have you noticed? This week all the major market averages moved higher with the Russell 2000 Small Caps (+1.85%) leading the way. The same is true for the month of June so far with the Russell up over 5% since June 2nd. Year to date, Large Caps are still the big winners with $SPX up 6.2% but the Small Caps are gaining quickly. You can watch all of the action using our Major Markets PerfChart:
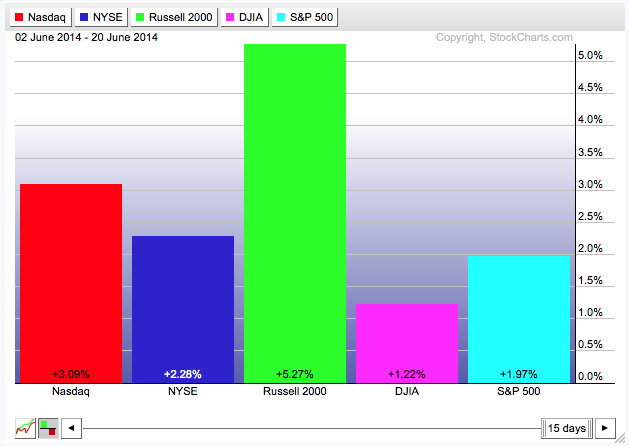
To see the exact chart above, click on the link for the Major Markets PerfChart, then click on the "Histogram" button below the lower left corner of the chart. Next, right-click on the horizontal date slider (i.e., the box below the chart that initially says "200 days") and select "Past Month". Finally, hold down the Shift key on your keyboard and press the right arrow key until the starting date in the upper left corner of the chart says "02 June 2014".
Use ChartStyles to Stop All the Clicking!
Are you a Serial Clicker? When you create a new SharpChart on our website, do you immediately start clicking all over the place to change its settings? Do me a favor; next time you sit down to use our charts, notice how frequently you click to change chart settings. If you click on more than 3 settings immediately after creating most of your charts, you my friend are a "Serial Clicker." The good news is that there is a cure for Serial Clickyness - and that cure is called "ChartStyles."
ChartStyles are essentually chart templates. A ChartStyle is a collection of all the setting that make up a SharpChart with the exception of the main ticker symbol. ChartStyles themselves are NOT charts - instead, they can be combined with any ticker symbol to create a chart. To use ChartStyles you need to be a StockCharts member. Members can save up to 50 different ChartStyles into their account.
Consistantly clicking on more than 3 different settings after creating a new SharpChart should be a signal to your brain that you need to create a new ChartStyle. It means that there is a set of settings that you use that you haven't yet captured. Once those settings are stored in a ChartStyle, you can quickly apply all of them to any chart by using just one or two clicks. Wouldn't that be nice?
Just like adding a new ChartStyle can be a huge time-saver, you also need to make sure you don't have too many ChartStyles. You really only want to create ChartStyles for chart settings that you use frequently. Hunting through a long-list of rarely used styles is not fun. The key then is to take a moment, reflect the different kinds of charts you typically look at when analyzing a new stock, and then create one ChartStyle for each of those chart types.
So what's an example of a good collection of ChartStyles? Many people use time periods as a starting point. The settings that you use for a 1-minute chart are usually different from the settings that you use for a weekly chart. Often the same is true for 10-minute charts, Hourly charts, Daily charts, etc. Each one of those "collections of settings" is a ChartStyle and you should save them as new ChartStyles in your account.
In addition to having a set of "time period" styles, many people often have a set of ChartStyles for different kinds of ticker symbols - i.e. Stocks vs. Indexes vs. Mutual Funds vs. Market Indicators, etc. Again, the key is to notice when you are clicking too much and then step back and think about the different types of charts that you are trying to create with our system when you do all that clicking.
For more on ChartStyles - including detailed instructions on how to create them and how to apply them to charts - please CLICK HERE to watch a great video put together by Arthur Hill.
ChartStyles really are the key to using your StockCharts account more effectively. I hope this article and Arthur's video will help you (and your poor mouse) stop all the clicking!
- Chip
