Hello Fellow ChartWatchers!
2014 has already been full of surprises both in the markets and here at StockCharts.com. From a market perspective it has been yet another great year to be a technician assuming that you trusted the charts and not the talking heads and experts. "The market is too high!" "It's overdue for a pullback!" "It is prudent to be on the sidelines in this environment." Did you listen? Or did you watch your charts instead? Check out what this chart has been saying so far in 2014:
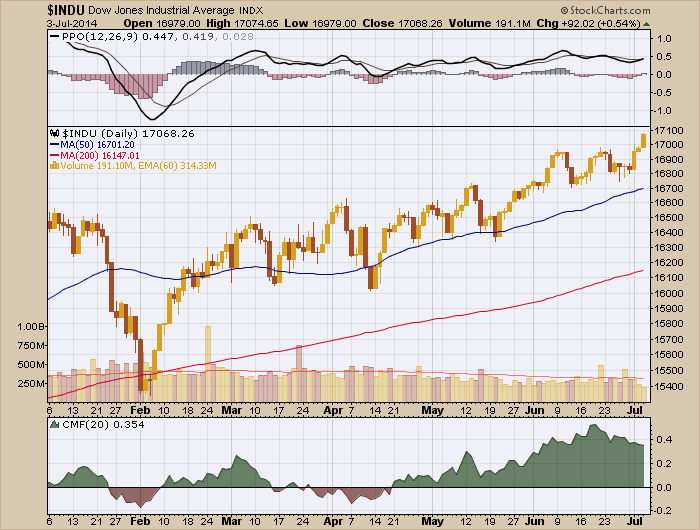
First off, except for a brief period at the start of February, the Dow was above its 200-day moving average so technicians should have had a bullish bias to begin with. Then, regardless of the technical indicator you followed, you should have been in the market much more than out. Do you like momentum? The PPO (a percentage-based version of the MACD) has been above zero since mid-February and above its signal line for much of that time. Do you like watching money flows? The Chaiken Money Flow has been positive most of the time also - certainly since late April.
There's only one worrisome signal on the chart above. Can you spot it?
Yep, declining volume since February is a warning signal but, by itself, it is not a reason to move to the sidelines especially if you are practicing sensible risk management techniques.
Now, my point is not "Buy! Buy! Buy!" - but instead I'm saying "Pay attention to the charts and ignore the pundits. The market is bullish until it isn't and the charts will tell you that long before the talking heads do." Headlines like this "Stocks soar, and most Americans just don't care" amaze me. Who doesn't care about making 2.97% in 6 months (11.03% since the February low)? And that's just from the Dow. The S&P 500 is up over 7.4% since the start of the year (14% since the February low)! Who doesn't love that? It is madness.
So the first half of 2014 has been the perfect time for pure technicians - i.e. those of us who truly just follow the charts. And, regardless of what the market does for the rest of the year, if you pay attention to the charts, you will always come out ahead.
Speaking of the rest of the year, what does StockCharts have in store for you between now and December 31st? A ton of great new things actually - here are some teasers for things to come:
- High quality historical data from Pinnacle Data - Pinnacle Data has been synonamous with accurate historical data for over 30 years. Knowledgeable technicians like Greg Morris and Carl Swenlin swear by these guys. And now that legendary data is coming to StockCharts! Over the course of the next month, we will be updating many of our ticker symbols - especially our breadth indicators - with Pinnacle Data that goes back much further than what we currently offer. The is a big deal for all of our users but especially our PRO members who want to conduct research using data as far back as the 1950s and even earlier. As an example of what you can look forward to, the Nasdaq 100 index ($NDX) now has data back to October 1985 (it used to end in January of 1992).
- Relative Rotation Graphs - These things are amazing (and also somewhat hard to explain). We are still working on finishing them but I can give you a "sneak peek" at what they might look like when we are done:
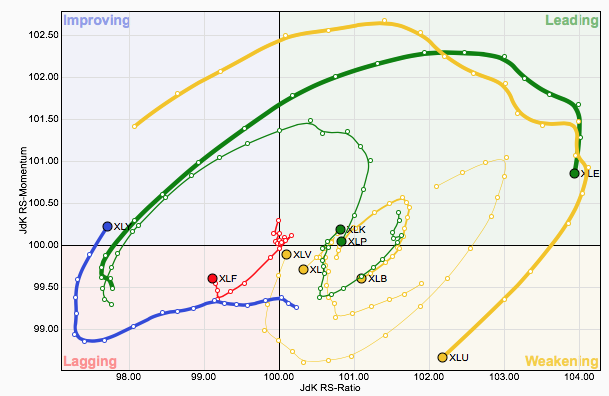
They will be interactive also - similar to our PerfCharts. Just don't ask me for an explanation yet! But don't worry, we will have a full explanation and examples available by the time this new tool is launched later this year. - International Data - Anyone here interested in charting stocks from non-North American exchanges? We are too! And because of that we are working hard on upgrading our datafeed so that it can handle more data - specifically more international data from places like India and England. We still have a ways to go with that work, but we hope to have it ready before the end of the year as well.
- New, Comprehensive Site Documentation - The Support area of our website is undergoing a complete re-write at the moment. When it is finished, we expect it will be much more helpful than our current documentation. Stay tuned for an announcement soon - this is a top priority with us right now.
- At Least Two New Bloggers - One of them will be helping everyone understand those RRG charts you see above and the other one will help us understand India's markets.
- Did I Mention ChartCon 2014? - It will be without a doubt our best conference ever with presentations from 14 industry experts (including 2 special guests just added to the agenda!). If you miss ChartCon, you will regret it. Given where the market is right now, don't you want to hear what the top technicians in the country think about the rest of 2014? Don't you want to learn first hand about all of the new tools we've added to StockCharts this year? ChartCon 2014 is the best way I know of to accomplish those goals. There are still a couple of slots left - click here to reserve your spot now.
- ...and the proverbial "much, much, more!" - Why should we stop now? I'm sure that we will soon add stuff even I didn't know about!
Thanks again for an amazing 1st half of the year and here's to an even better second half!
- Chip
