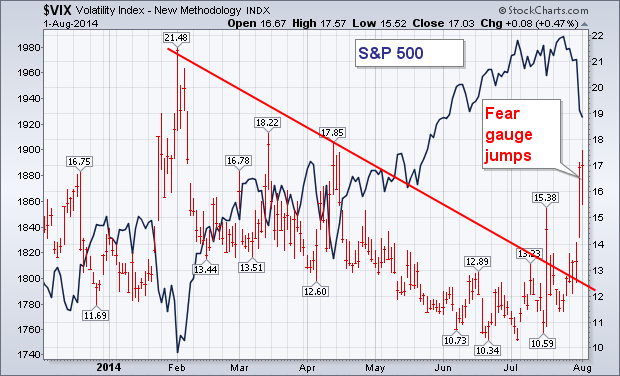
As usually happens when stocks weaken, the CBOE Volatility (VIX) Index jumped sharply this week to the highest level since April. The VIX (also called the "fear gauge") has climbed 47% since the start of July. That means that traders are buying "option" insurance against a possible downturn in stocks. The red bars in Chart 10 show that the recent upturn in the VIX is the biggest since January. That's consistent with a short-term correction. A move above its spring highs, however, (18.22 and 17.85) would be more cause for concern. Generally speaking, VIX closes much above 20 often signal a major downside stock correction, while moves above 40 usually mark major bottoms. The last time a decisive VIX move above 20 triggered a major correction was between July and October 2011, when the S&P 500 lost nearly 20%. Stocks bottomed that October with the VIX peaking at 48. [I pointed out earlier this year that downside corrections ending in October are also common during midterm election years -- like 2014]. That doesn't guarantee that a similar pattern will form this year, but seasonal and historical tendencies shouldn't be ignored. To quote Mark Twain: "History doesn't repeat itself, but it rhymes."