ChartWatchers

CRB Index is Testing Major Support

John Murphy

John Murphy

Chief Technical Analyst, StockCharts.com

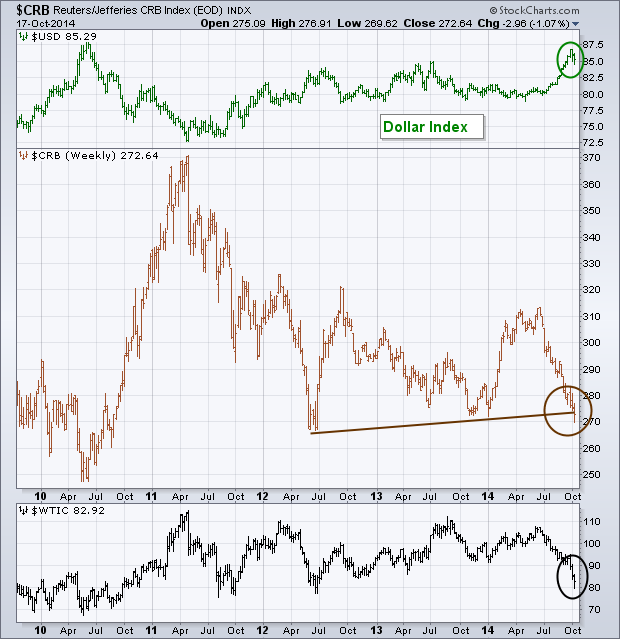
Today's message takes a look at commodity prices because they've been the focus of a lot of attention of late. That's because falling commodity prices are deflationary in nature, which is something central bankers are trying to stop. The weekly bars in Chart 1 show the CRB Index of nineteen commodities threatening a support line drawn under its 2012/2013 lows. Crude oil weakness has been a big drag on the commodity index (black bars). Despite a midweek bounce in crude, signs of a major bottom are still lacking. One of the main catalysts behind the commodity drop has been a rising dollar. The Dollar Index has suffered a minor setback over the last two weeks (green bars). But its uptrend is still very much intact. That's not an encouraging sign for commodity markets and the battle against global deflation.

John Murphy
About the author: is the Chief Technical Analyst at StockCharts.com, a renowned author in the investment field and a former technical analyst for CNBC, and is considered the father of inter-market technical analysis. With over 40 years of market experience, he is the author of numerous popular works including “Technical Analysis of the Financial Markets” and “Trading with Intermarket Analysis”. Before joining StockCharts, John was the technical analyst for CNBC-TV for seven years on the popular show Tech Talk, and has authored three best-selling books on the subject: Technical Analysis of the Financial Markets, Trading with Intermarket Analysis and The Visual Investor. Learn More