Stock market action played out the past two weeks almost perfectly according to historical plan. In my last article, I discussed the bearish tendencies of equities from December 7th through December 15th and the S&P 500 promptly lost 85 points, or more than 4% during this period in 2014. But the historical faucet seems to turn from arctic cold to blistering hot overnight as December 16th is the trigger point for the bulls from an historical perspective. Right on cue over the past four trading sessions, the S&P 500 regained nearly every point that it had lost during the bearish period. The net result was almost nil, but traders that were aware of the historical pattern were able to take advantage of both sides of the trade. Pretty amazing, huh?
The good news is that the bullish tendencies don't typically end on December 19th. In fact, the stock market remains historically bullish through the first three weeks of January so I don't see the overall bullish action letting up any time soon. Where can we look for additional strength then? Well, I'd start with industry groups that are breaking out and outperforming on a relative basis. One obvious industry group that fits this criteria is the Business Support Services index ($DJUSIV). Check out the chart:
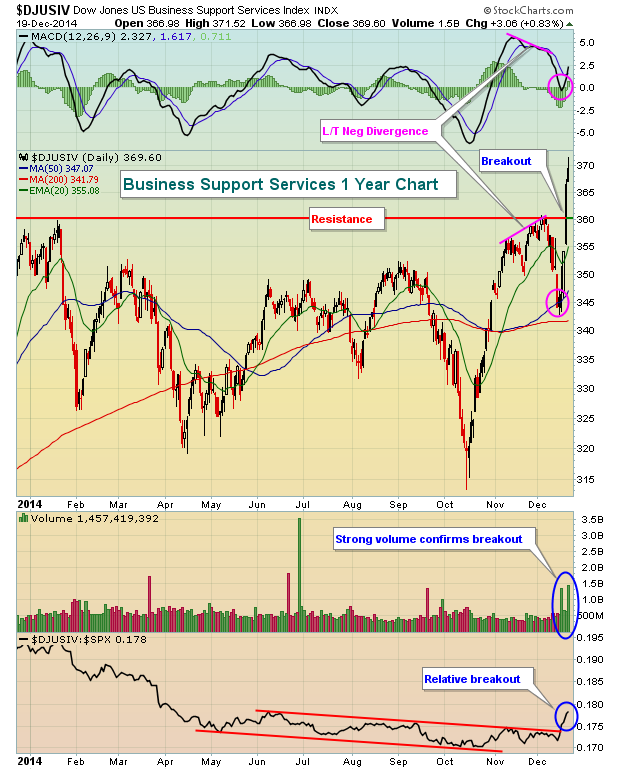
There are a ton of positive technical developments here. First, the DJUSIV has been in a base formation throughout 2014, so a breakout on heavy volume is a very bullish sign. Also, on its most recent high in early December, a long-term negative divergence printed with a price trip to the 50 day SMA and a MACD trip to centerline support more likely. That's exactly what we saw as the pink circles highlight. Perhaps most important, there was finally a break of the relative strength down channel that the DJUSIV had been in since the first half of 2014. So now we have a breakout on heavy volume after a long base with relative strength surging. It's probably not a bad time to consider exposure to the group, especially if the DJUSIV pulls back near 360 to retest its breakout level.
I've included a company within this business support services space as my Chart of the Day for Monday, December 22, 2014 to hopefully take advantage of future relative strength from this group. It's FREE so simply CLICK HERE to register and begin receiving your daily Chart of the Day.
Happy holidays and happy trading!
Tom Bowley
Chief Market Strategist
Invested Central
