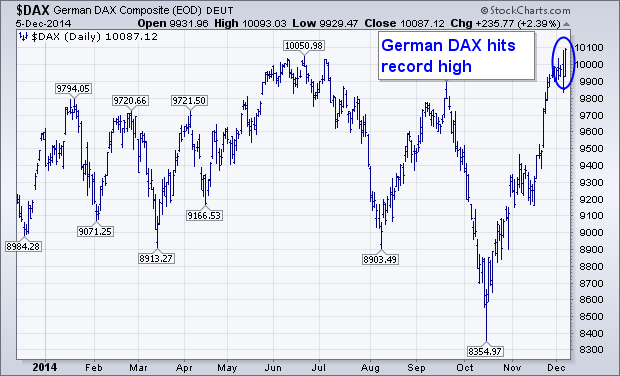
German stocks sold off Thursday after the ECB delayed further monetary easing until the first quarter. Later reports that more monetary stimulus might come as early as January helped boost European stocks which rallied sharply on Friday. Chart 1 shows the German DAX Composite Index jumping 2.4% on Friday to reach a new record. Other eurozone stock markets jumped as well. France rose 2.2%, Spain gained 2.6%, and Italy 3.4%. Friday's strong jobs report in the U.S. may have also improved market sentiment in global markets. The only laggards were oil producers like Brazil, Canada, and Russia. Oil importers like China and Japan hit three and seven year highs respectively. That puts most global stock markets on a sounder footing. Most foreign currencies fell however as the U.S. Dollar hit a new eight-year high. That was due mainly to a big jump in U.S. rates on Friday following the strong jobs report.
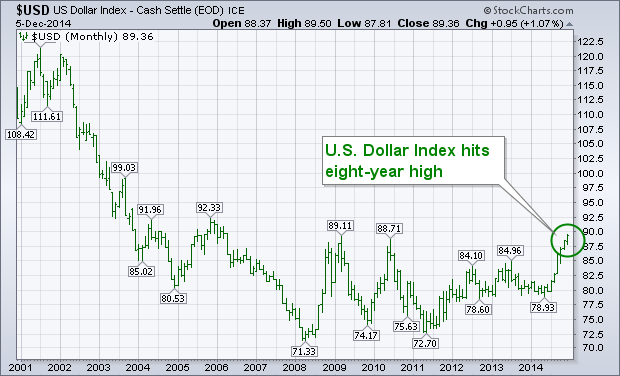
The monthly bars in Chart 2 show the U.S. Dollar Index ending the week at the highest level since 2006. The USD closed slightly above its 2009 and 2010 highs. Any chart reader will recognize that as a major upside breakout. The USD had fallen between 2002 and 2008 before bottoming. It has traded sideways since then in an apparent bottoming formation. This week's upside breakout has completed that bottoming formation and signals the likely start of major uptrend in the U.S. currency. Chart 2 suggests that the bull market in the dollar has a lot further to go both in price and time. Dollar strength is one of the main reasons why commodity markets are in major downtrends. It also explains why commodity exporters are underperforming and commodity importers outperforming on the global stage. The main reason for dollar strength is the growing discrepancy by rising U.S. interest rates and low foreign rates.