It's easy to follow the crowd and buy what keeps going higher. But generally larger gains can be found in healthy areas of the market where we've seen months of consolidation, awaiting that next breakout. As an example, it wasn't that long ago that home construction stocks ($DJUSHB) looked like a broken group. Take a look at the DJUSHB chart as of early October:
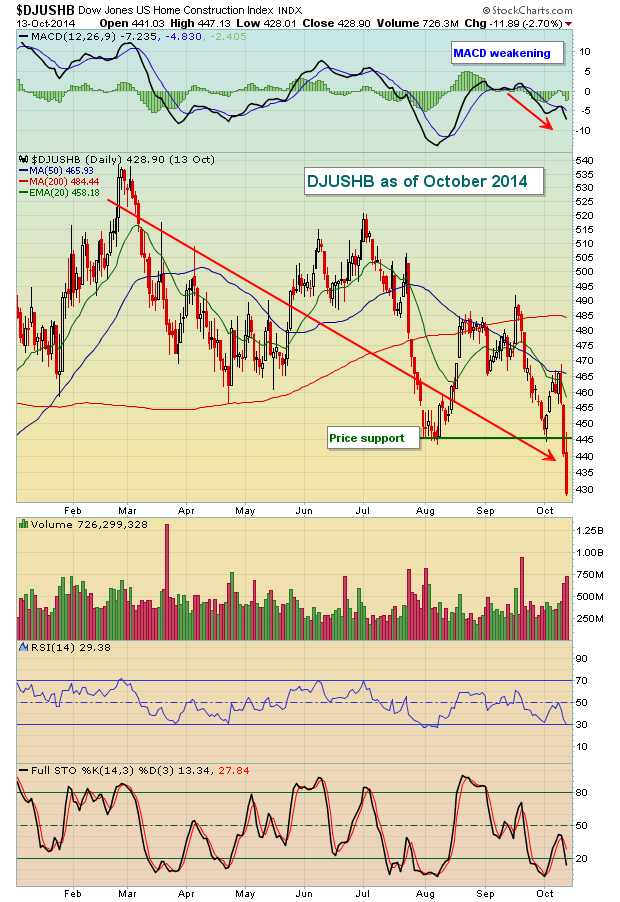
As our major indices struggled back in October, it was fairly clear to see that home construction stocks were not exactly desirable from a technical perspective - at least not based on this year-to-date chart. They broke down to a fresh 2014 low on October 13 and appeared to have accelerating momentum to the downside to boot. But astute technicians realized the big picture wasn't bad at all and the selling in October actually created opportunities within the space. While that daily chart was looking so bearish, take a look at the longer-term bullish continuation pattern (ascending triangle) that was forming:
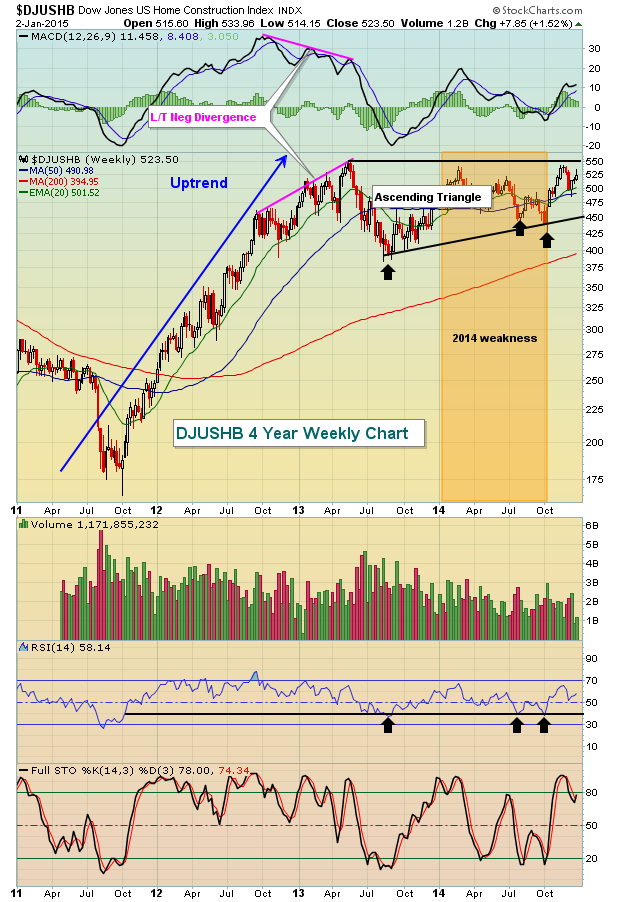
This longer-term view shows a much different technical picture than the 2014 year-to-date view as of October. Home construction stocks appeared to be damaged goods, not worthy of attention based on the shorter-term view. Yet on the long-term weekly chart, that October low was firmly within a very bullish ascending triangle pattern and showed a weekly RSI near 40 - generally a solid entry point during an uptrend. The rest is history as home construction stocks performed among the best consumer discretionary industry groups in the fourth quarter. In addition, a breakout on the DJUSHB above 550 triangle resistance could lead to substantial gains in 2015 so this group is worth keeping on your radar.
Now let's move on to 2015 and a group that's struggled on a relative basis in 2014, but certainly could be poised technically for a major breakout in 2015 - industrial machinery ($DJUSFE). Look at the 4 year weekly chart:
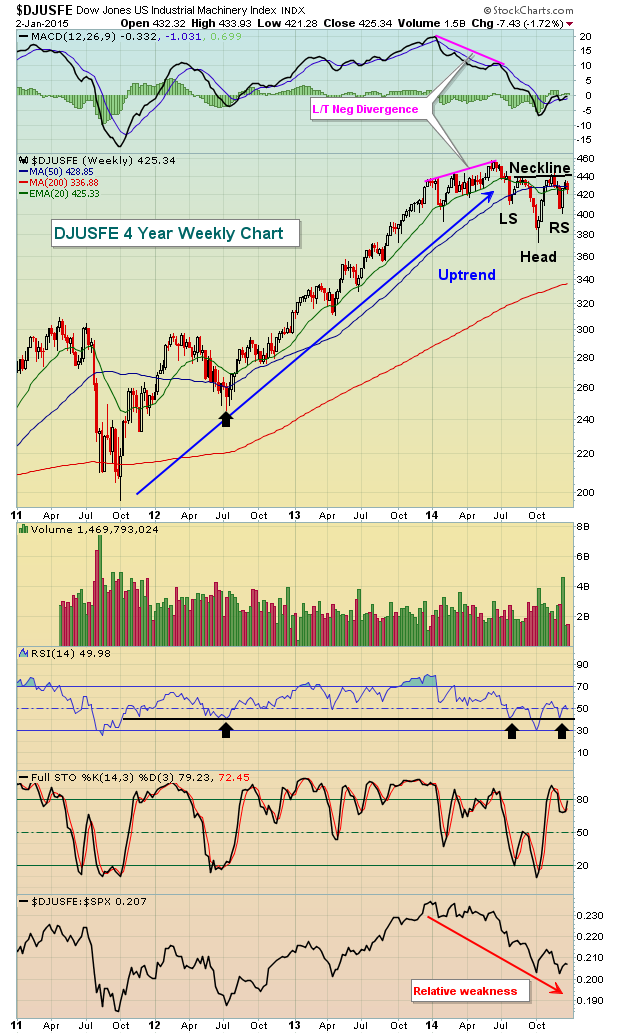
It's clear to see a major uptrend from late 2011 through early 2014. At the bottom of the chart you can also see that the DJUSFE was outperforming the S&P 500 throughout much of this advance. It's also easy to see the nasty long-term negative divergence that formed on the highs in the first half of 2014. That was a clear sign of slowing upside momentum and the DJUSFE struggled during the second half of 2014. Put another way, money rotated away from this group for awhile as the consolidation process unfolded. The good news - and perhaps the overlooked news - is that the DJUSFE is currently in a very bullish continuation inverse head & shoulders pattern. Should it break above 440 with force, this pattern measures ultimately to 510, or 20% higher than where it begins 2015.
I've searched to find an individual stock within this space that could be poised for a significant move higher if, in fact, this breakout in the DJUSFE occurs. I'm including it as my Chart of the Day for Monday, January 5th. CLICK HERE to sign up for my Chart of the Day for FREE!
Happy New Year and Happy Trading!!!
Tom Bowley
Chief Market Strategist
Invested Central
