Last year, the bond market surprised us by making its low on December 31 and it went on to rally all year. Gold and the gold miners made a tradeable low December 2013 and rallied for a few months. So I though I would dive into the gold charts today to see if this might happen again.
One thing we want to see happen is Gold Miners (GDX) outperform Gold (GLD) . Here is the ratio chart. If it is turning up, the gold miners are starting to outperform the metal. That is usually a precursor to at least a good rally. When this moves above the 50 DMA its a good place to pay attention. Notice the big rally off the December 2013 low and June 2014. December-June-December has a nice spacing. A particular point of interest for me is the higher MACD on the most recent low even though the ratio made a lower low. This positive divergence is nice to see.
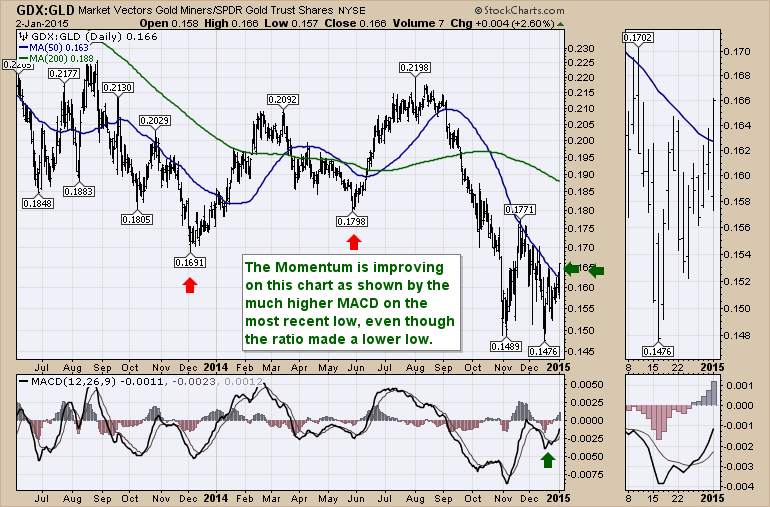
Chart 1
There are 4 big pushes up on the GDX shown in the bottom of this gold (GLD) chart (Chart 2) off the lows. Compare GDX to GLD. This price action on the gold miners even though gold didn't do much is very interesting price action, confirming my suspicion that something might be changing on the gold related trades.
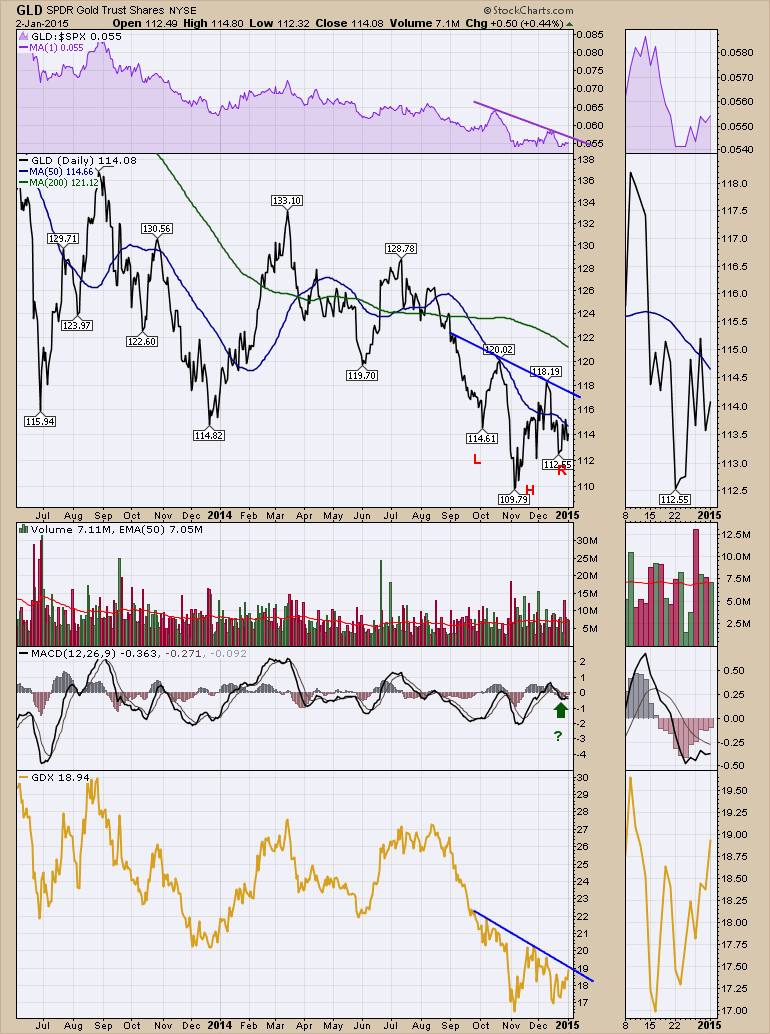
Chart 2
Staying on Chart 2, the MACD for the GLD on the most recent low is trying to turn up just below zero which is also very important. We see these MACD tests near the zero line on nice breakouts. Should it not cross the signal line here and roll back down, that would change my view to negative. So this is a critical place to watch, but the MACD for GLD is improving and has not signalled yet. However, the momentum of the GDX chart in the bottom panel is right up against the down sloping blue trend line where it is not on GLD. This suggests something is changing and the miners are trying to get going. Even though the $USD soared on Friday, the gold miners had another good day as shown in the zoom panel. That is the fourth good up day in the last 2 weeks since the December 18th low on GDX. Lastly, some individual charts are starting to break out to 2 or 3 month highs.
Below is Agnico Eagle (AEM.TO). Look at the big push Friday in the face of a soaring $USD and GLD only moved up almost a 1/2% on the day.
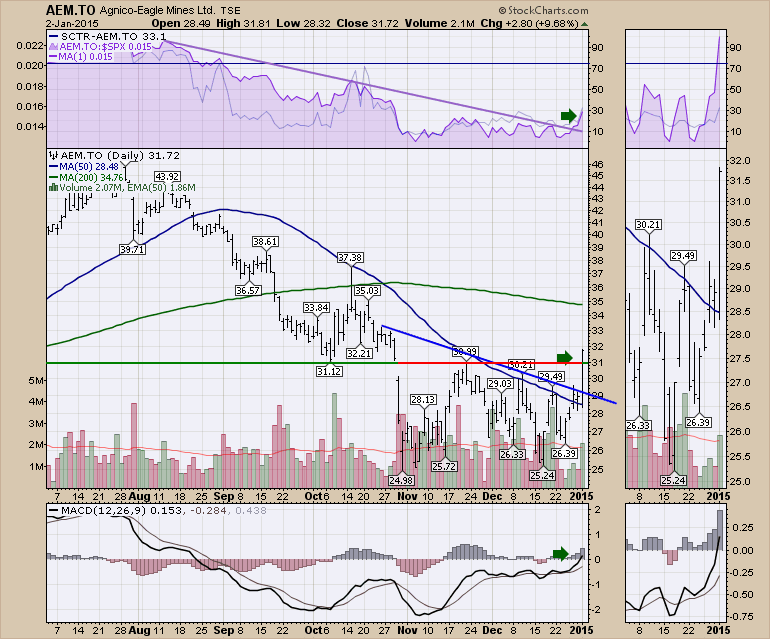
Chart 3
There are other good looking gold charts right now. It may all fall apart, but it looks interesting here. The seasonality of the GDX:GLD, the big pushes up in GDX, both the miners and GLD climbing even though the $USD is still making new highs are all working together to tell me something is worth watching here. Find your favourite gold miners this weekend and put them on your radar. It might make for a very profitable first quarter.
Good trading,
Greg Schnell, CMT
