Hello Fellow ChartWatchers!
The other day I was out with my Dad and he said "Boy, the market has been really volatile recently hasn't it?" And I said "Umm, not really. Where did you hear that?" "All the cable news channels are talking about it." And then, in my whiniest voice, I said "D-a-a-a-d. I've told you again and again to be skeptical of those programs." He knew I was joking but there was some truth to it also. I pulled out my computer, brought up StockCharts and showed him this specific PerfChart:
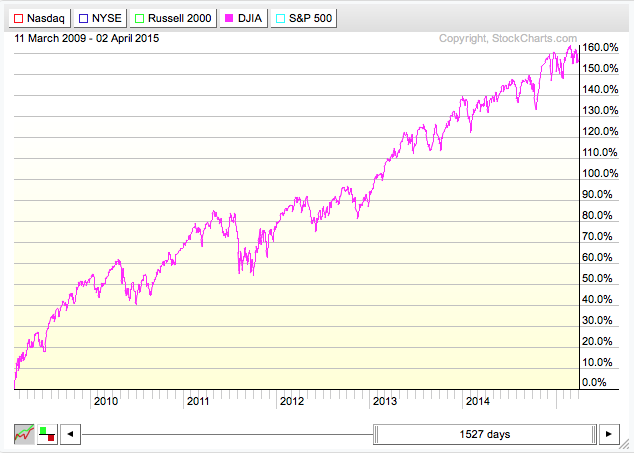
(Click the chart for a live version)
What's happening is that the news channels hear that the Dow moved 100+ points and they decide it is a major story worth covering. What they don't understand is that these days 100 points is only 0.5682% of the Dow's current value. Barely over 1/2 of 1 percent! That's not major news and it's definitely not "increased volatility." Investors (and news stations) should only care about percentages. The chart above shows that there is nothing notably different about the Dow's current moves relative to bigger moves made in the past 6 years (since the 2009 bottom).
Dad knew to only look at percentage, but forgot in the heat of the moment. It's easy to do. He was glad that I reminded him.
Using SCTRs to Narrow Your Search for Winning Stocks
We've recently done several webinar broadcasts about scanning. Scanning is super important to technical traders. Of the 80,000+ ticker symbols in our database, which ones are worth looking at? Scanning narrows down that list to a much more manageable number. And by combining scanning with our SCTR rankings, you can quickly narrow things down to just a few stocks worth looking at.
SCTR (pronounced "Scooter") stands for "StockCharts Technical Rank." It is a number that ranges from 0 to 100 depending on how strong a stock's technicals are relative to all the other stocks in a given group. For instance, if a large cap stock has a SCTR ranking of 50.0, you can conclude that its technicals are better than 50% of the other large cap stocks that we cover. For more details on SCTRs, please see our ChartSchool article on that topic.
One of the great things about SCTRs is that they can be used in scans. By using SCTRs in your scan, you are automatically weeding out underperforming stocks and that makes your scan criteria much simpler. Let me show you...
Let's say that we are a typical investor with some cash on the sidelines and we're looking to get into the market. We'd prefer to go long (buy low, sell high) and we'd like to invest mainly in momentum plays - i.e., situations where a stock has starting moving higher again after a significant bottom.
Now, you could take time to research all of our technical indicators and work up a multi-step scan criteria with lots of ANDs and ORs and square brackets, or you can "cheat" and use SCTRs. For the purposes of this article, let's cheat. If a stock starts moving up after setting a significant bottom, its SCTR value will probably start moving up from the 10-20 point range into the 40-50 range (and hopefully even higher soon after that). So our "cheating" approach is to simply find stocks that have had SCTR values below 20 for at least the previous 3 weeks but now have SCTR value that are above 40. Here's that sentence in Scan Speak:
[5 days ago max(15, SCTR) < 20] and [today's SCTR > 40]
"What could be simpler?" (No, seriously. This is much simpler than most scans out there.) The only mildly tricky part is knowing that the "max( )" function finds the largest value over the specified number of days (15 in this case). We use a 5 day offset in front of the max( ) function so that the max( ) function starts looking at values starting 5 trading days ago (i.e. from 5 days ago to 20 days ago). Again, in English, this scan finds all the stocks that had low SCTR values over the previous 3 weeks but then had their SCTR value rise to above 40 since then.
When I run that scan right now (Saturday afternoon), I get 7 results:
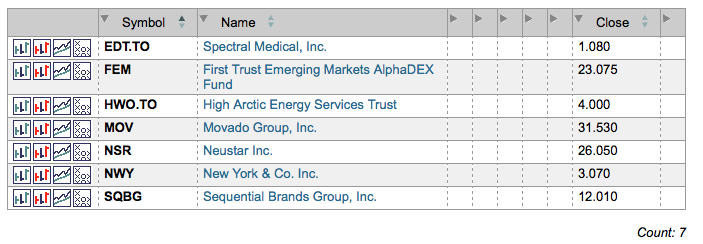
Looking at the prices, my eye immediately goes to FEM, MOV and NSR (and possibly SQBG). Those stocks have good pricing and good volume and (as we now know) good technicals! Here's the chart for Neustar for example:
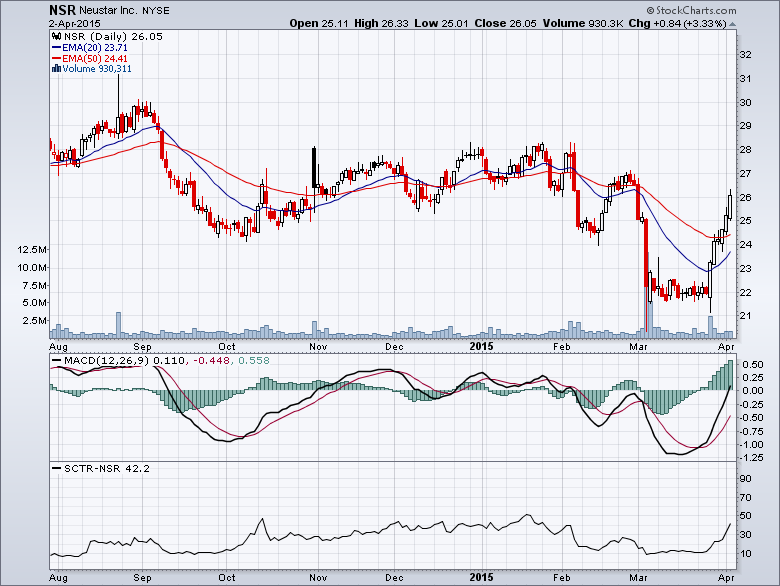
That is a very nice breakout after a low base!
And finding this stock was so simple. Notice that this scan doesn't have lots of extra clauses for price ranges or volume filters or stock groups. All that is essentially handled automatically because we used SCTR-based criteria.
Now you might be asking yourself "Can I change the numbers that I used for my scan to be more aggressive or more conservative?" Absolutely! For example:
More Aggressive:
[3 days ago max(15, SCTR) < 20] and [today's SCTR > 30]
More Conservative:
[5 days ago max(20, SCTR) < 20] and [today's SCTR > 50]
Those are just two examples. Go nuts testing other possibilities. Just remember that you'll want to test things in various market conditions - up markets, down markets, sideways, etc. (You can do that by change the "Starting ___ days ago" setting at the top of the Scan Workbench.)
SCTRs and Scanning really are two great things that go great together. (Kind of like the peanut butter I'll be spreading on my Easter chocolate tomorrow!)
Enjoy!
- Chip
