Back in December we reviewed a group of Solar related stocks and positioned our ChartLists for alerts if they did break out. Well, that worked out swimmingly well as January brought the all clear and the stocks soared. Lots of them shot up and made nice big moves to the upside. But as time rolls through, each day is a data point and the charts have some major tests of support in play right now. The solar stocks sold off when crude oil sold off and started to turn up before crude turned up. Now the question is what to do when the price of crude oil has been range bound for two months. The solar charts couldn't be more mixed. Sun Edison (SUNE) is the lone ranger hitting new highs week after week.
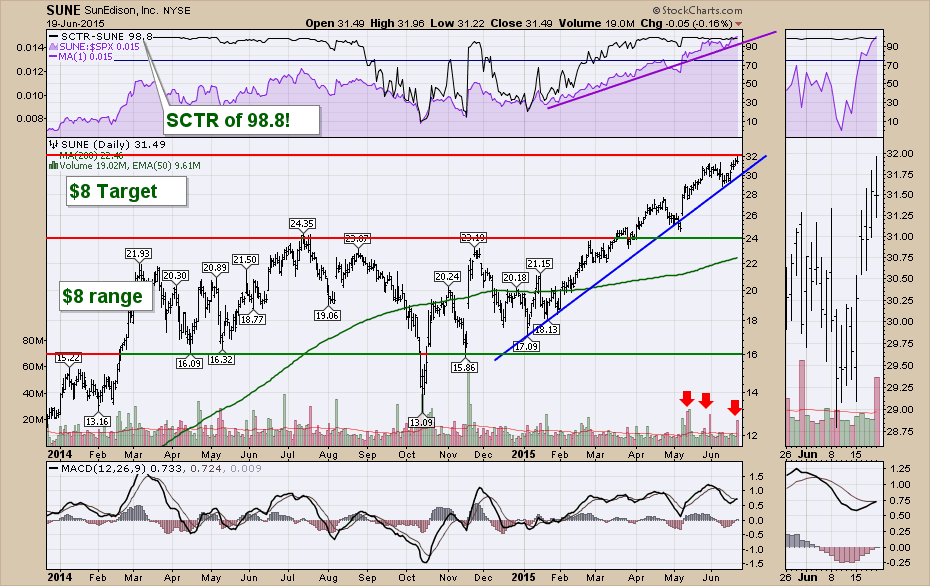
While the target for Sun Edison is $32 just based on simple channel width measurements, Friday's high is close enough for me. That's the bull case. The rest of the charts don't look as sunny. I'll focus the rest of this article on the Solar ETF, TAN.
Here is the chart for the Solar ETF (TAN). While it has a wonderful name, the technicals on the chart feel like they have thunder clouds looming. Will they just blow past or will they unleash a storm? The SCTR is still nice and high. However, it gave a thunderstorm warning when the SCTR dropped from the 90's to the 60's. This weakness can sometimes signal a looming change in trend. If you look back to 2014, there are some interesting signals that we got from the SCTR. After being pinned to the top of the ETF group for months during the early part of the year, the SCTR suddenly dropped and rebounded. In May, 2014 the stock price tested the 200 DMA. With a big rebound the SCTR bounced back up in June 2014. It gave us one more chance to exit near the highs with a final push in September 2014. This change in trend can be an ominous sign. Currently the SCTR pullback has been mild, but the price action was a big drop of 20% with a major gap. Now some solid resistance sits at $44-45 after the 200 DMA test.
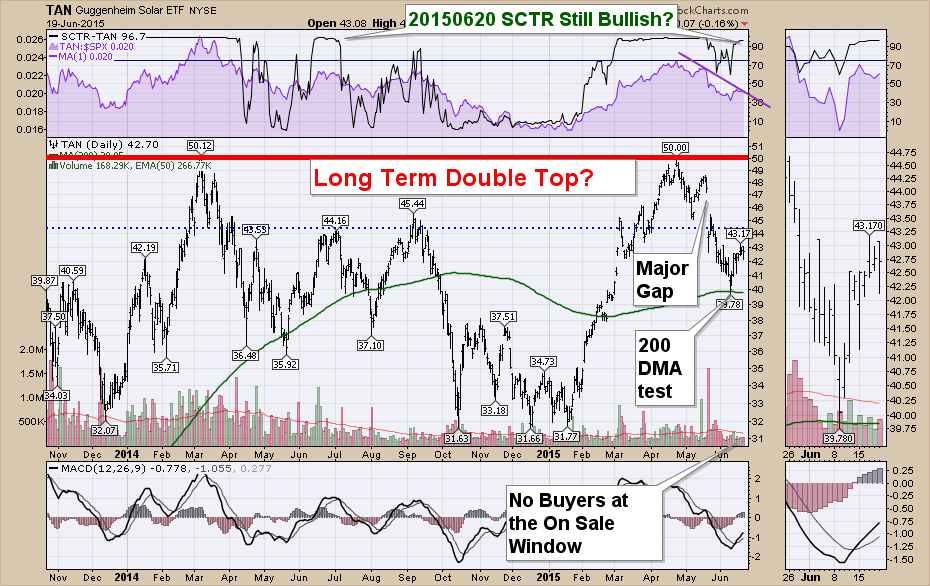
Probably the most difficult information on the chart is the lack of volume in a sun drenched June. Even the bounce off the 200 DMA couldn't produce an above average volume candle. With Thursday's across the board rally in the US markets, the Tan ETF had 103,000 shares change hands. The typical low volume level is 100,000 and usually marks a trend change. No one seems to be running to any of the energy industry groups now which leads me to believe the energy sector has another leg down. If the oil price, Natgas price, solar price and coal price continue to wobble, what will hold the energy sector up? I published a chart of the $USD on Don't Ignore This Chart which is currently at a neck line for support. If that holds, which is what support levels are supposed to do, then the weakness in energy could persist. If the $USD breaks below support, that could help oil and commodities in general. Will that feed into solar as an energy contributor as well?
While I wouldn't be aggressively shorting solar because we are hitting new highs on the indexes, the double top denoted by the red line on the TAN chart is in play. With a 1 year spacing, it's important to keep the big picture in mind.
Let's look at the TAN chart on the weekly over 7 years to see the big picture. Starting at the top, the SCTR has given us pretty good warning signals after a long run. The three red circles suggest a dip, a bounce back and then a rollover. The purple SPURS are trending down which is a difficult pattern to expect new money to move into. The price ceiling at $50 couldn't be at a more important support and resistance line. The support level of $32 becomes a critical support level. A flat 40 Week MA shown in green is cautionary when it is making a lower high on the MA from the 2014 high.
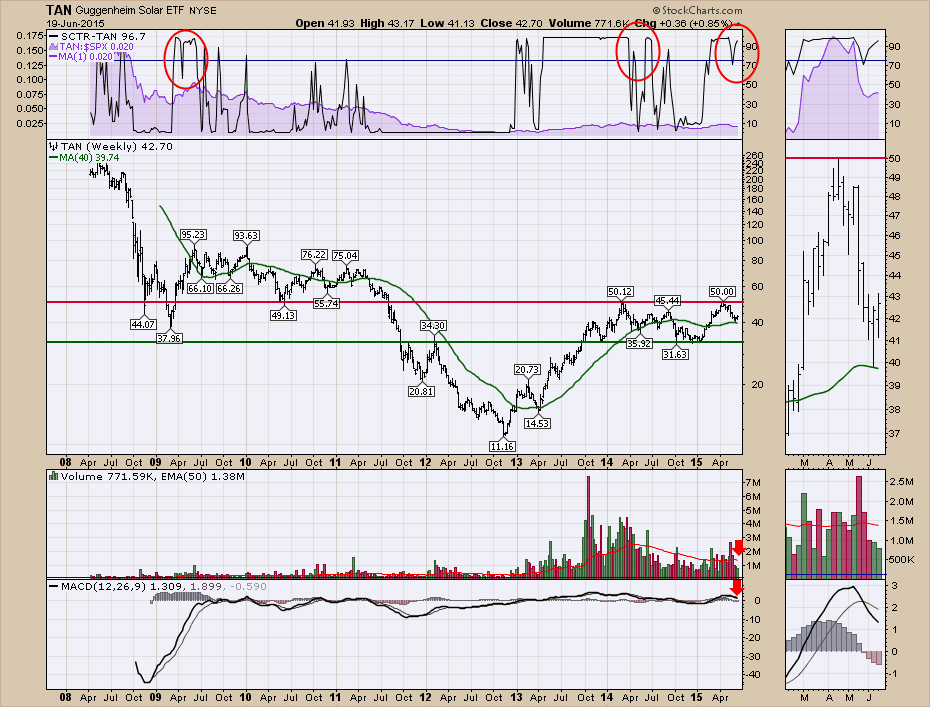
With the volume trend rising during the 2013 up trend, weekly volume continued to be close to the 50 Week EMA. Our recent volume is about 60% of the EMA. That doesn't feel bullish or look bullish. The MACD has rolled over and the chart lacks sunshine. If you are long solar, you may wish to tighten your stops as the trends appear weak unless the support on the $USD breaks. That might change the weather outlook for this sector.
Good trading,
Greg Schnell, CMT
