
It seems like an easy enough concept to grasp. If a company has strong fundamentals (earnings) plus a strong chart (technicals) it should make a stock a strong reward to risk trading candidate. It turns out it does.
As part of Invested Central we provide a service that zeroes in on companies that beat earnings and also have strong charts. This allows us to put stocks on our "radar screen" and to provide members with ideas that they might find fits their trading strategy.
We wanted to determine if the combo of strong earning (beat expectations) and strong charts produced positive results so we went back to September of last year to track the performance of those stocks that made our "Watch List"; that is stocks we shared with our members that met our criteria.
There were a total of 39 stocks provided between September 2014 and April 2015 but because there can be multiple entries on an individual stock there were 59 trade "opportunities." Of these 59 potential trades 77% had positive results. The largest individual gain was almost 60% while the largest individual loss was almost 14%. But, there wasn't one stock in the group that didn't go higher at some point while it was active on our Watch List, meaning there was an opportunity every single time to realize substantial profits.
This is all very important and useful information because it backs up the notion that earnings do indeed matter and especially if you can identify those companies with strong earnings that also have strong technical charts. It's simply another way to put the odds in your favor.
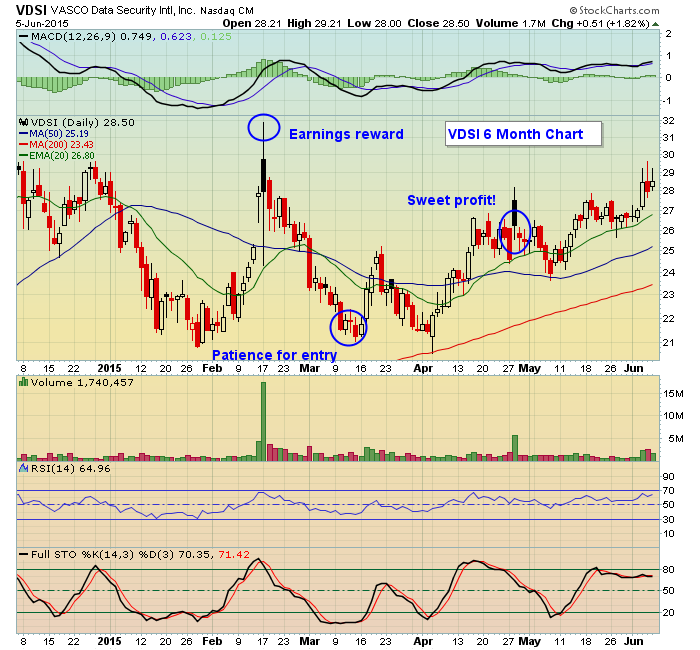
VDSI is a great example to look at. The company handily beat earnings expectations when it reported its numbers on February 17. It went up sharply on extremely heavy volume, hitting a 52 week high, but it was technically extended. So it was on our radar screen and we waited patiently for a good reward to risk entry level. That came on on March 10 when it had pulled back nicely and was challenging late January lows. It subsequently held its important 200 day moving average and then proceeded to head higher where we exited on April 29 almost a 20% winner, and even today the stock remains strong.
I put together a performance chart showing the results of all 59 trade opportunities that includes the date added and removed, the entry price, the high price and the exit price and % gains and losses. If you want to see the chart just click here and you will be able to see the full picture.
As traders we're always looking for ways to get an edge. Seems like companies that beat earnings expectations and have solid technicals stand up quite well, no matter the market environment.
At your service,
John Hopkins
President
Invested Central/EarningsBeats.com