Utility stocks benefited as much as any sector during the unprecedented drop in treasury yields. Those who seek income were forced out of treasuries the past several years because of historically low treasury yields and they found a home in utilities. The problem now is that treasuries are being sold hand over fist and the rising 10 year treasury yield ($TNX) is making utility stocks less and less attractive. This relationship can be seen quite clearly in the following chart:
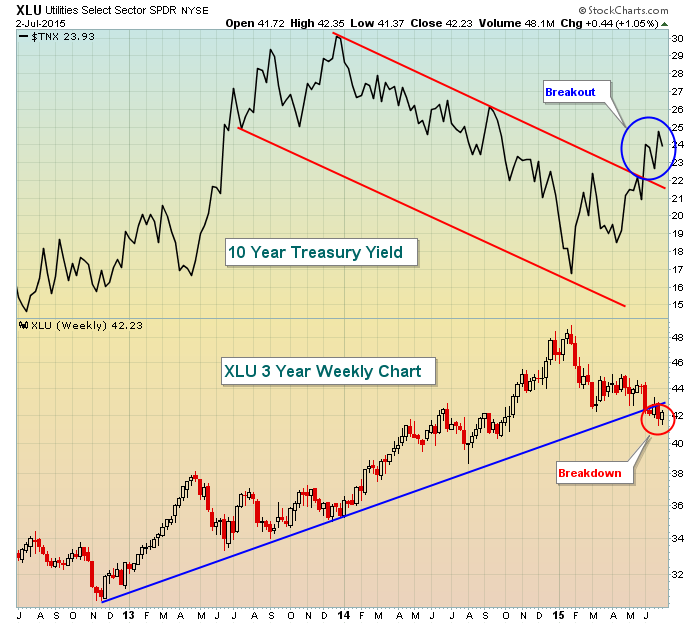
We have a break in the downtrend channel of the 10 year treasury yield and a break in the uptrend of utility prices. Most in the market believe the Fed is looking at when, not if, they're going to raise interest rates. The treasury market certainly believes that to be the case as the yield has broken out to the upside. The scary part for those holding utilities is that treasury yields could move much higher over the next year and still remain in their long-term (35 year) downtrend. Check out this longer-term view of treasury yields and how much further we COULD go and still remain in that long-term downtrend:
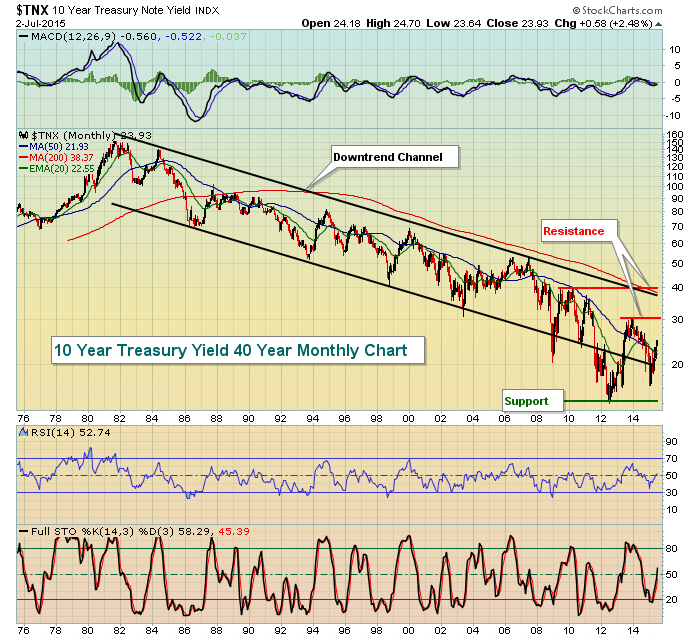
The next major resistance on the TNX appears to be 3.00% and I'd be surprised if we don't get there given the economic conditions and recent statements by Fed officials. That continuing rise in yields will likely make utilities one of the worst performing sectors, if not the worst, of 2015. If you are holding utilities, your hope is that our economy is not nearly strong as suggested and yields roll back over to the downside.
I'll leave you with one final thought and chart:
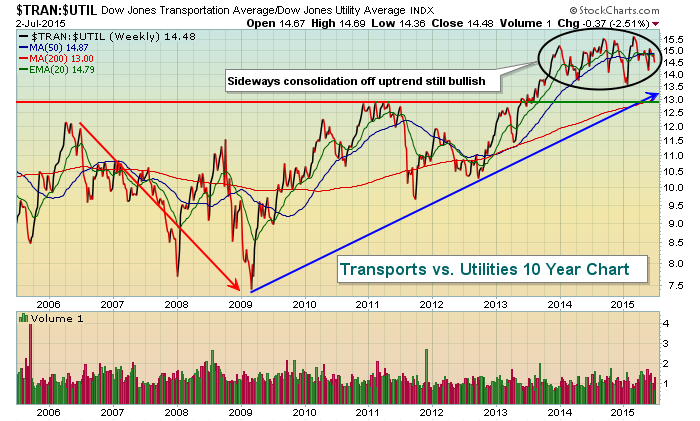
Transportation stocks generally outperform their utility counterparts when the market is anticipating a strengthening economy. The opposite occurs during economic contraction. As you can see from the above red arrow, transportation stocks underperformed utilities just before the 2007 bear market started - a warning sign. That relative weakness continued until March 2009 when the current bull market began. The blue arrow shows that we still remain in a strong relative uptrend. Considering how weak transportation stocks have been in 2015, the fact that their relative strength vs. utilities remains bullish goes a long ways to illustrating just how weak utility stocks are. I also find this relative strength comforting in terms of the strength and sustainability of our 6+ year bull market. If we were staring a bear market in the eye, I would expect that this relative chart would have broken down by now. Of course, we do still have the seasonal bearish months of July, August and September directly in front of us.
Oh how I love this stock market puzzle!
Happy trading!
Tom
