 There are many sources that DecisionPoint uses to develop the DP Sentiment charts. You'll find two of them in the free DecisionPoint Gallery: American Association of Individual Investors (AAII) Sentiment and Rydex Asset Ratio. I'm going to review the AAII, National Association of Active Investment Managers (NAAIM) and Rydex Cashflow charts from the DecisionPoint Market Indicator ChartPack and DecisionPoint Rydex Funds ChartPack (available for download to Extra and above members). With market action and indicators sliding into neutral, sentiment charts are very helpful in determining the current health of the market. The sentiment indicators I'm reviewing today, with the exception of the AAII chart, take into account what actual money managers are objectively doing with their funds. This can be much more enlightening than a subjective survey.
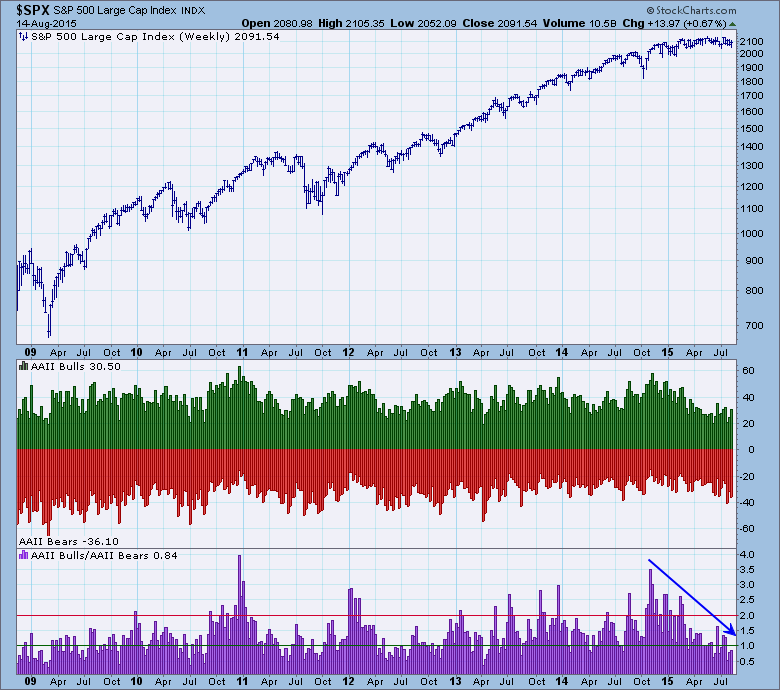
However, let's start with the subjective AAII chart. AAII takes a weekly survey by asking its members if they are bullish, bearish or neutral. These results are usually available at StockCharts on Thursday evenings. The bull/bear ratio is decreasing in value, this means that bearish sentiment outweighs bullish sentiment.
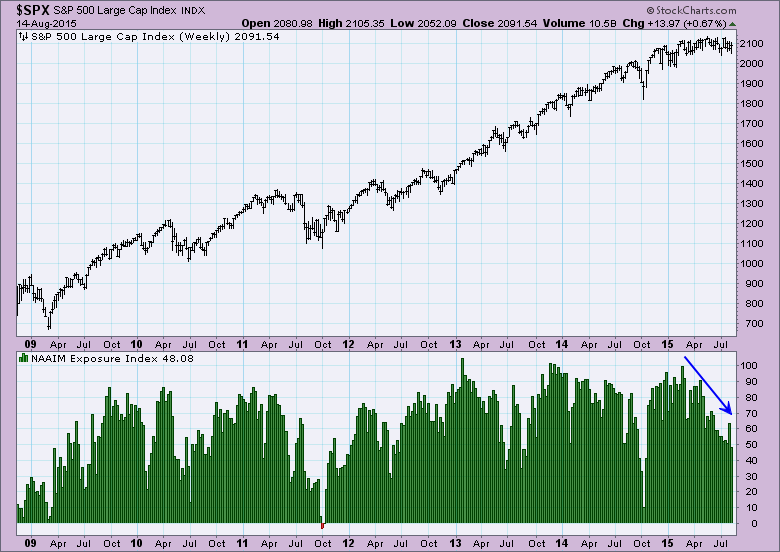
NAAIM is a professional group that reports its exposure to US stocks on a weekly basis. The exposure index reflects the average exposure of NAAIM members. This data is updated by Thursday evening. I like this indicator because it tells us exactly how exposed real money managers are to the market. Notice that exposure continues to decline. It hasn't hit extremes yet, so I find this bearish.
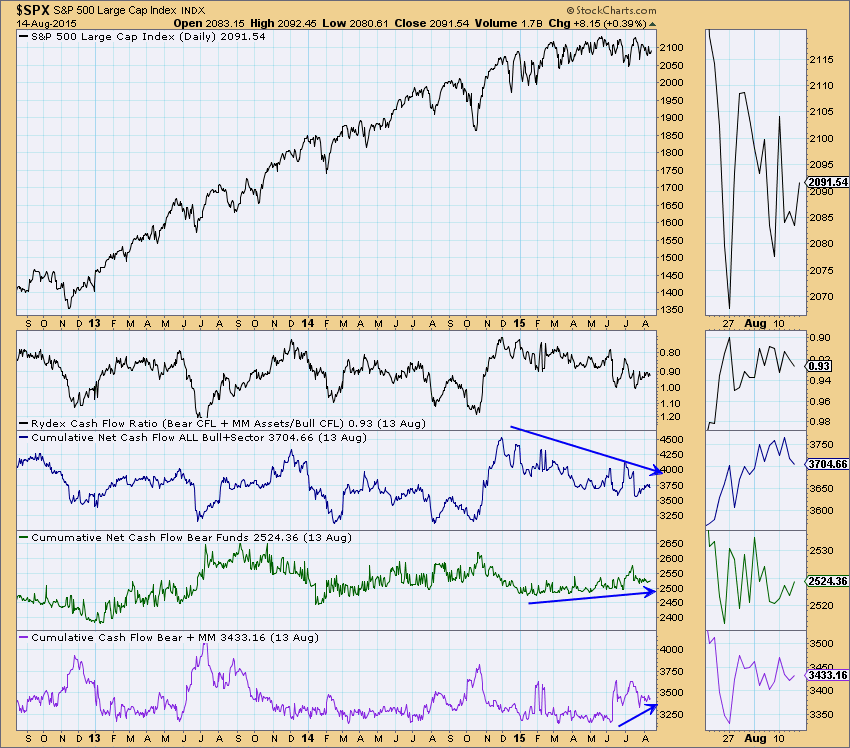
The Rydex Cash Flow Ratio uses an estimate of money that has been committed to bull and bear funds, so it is a fairly accurate reflection of actual psychological extremes. Notice that money is flowing away from bullish positions and into bearish positions. The Cash Flow Ratio is still showing more bullish participation than bearish (when the denominator is larger, the ratio is less than one), but looking at where the cash is going, I find these indicators bearish.
Conclusion: You'll find DecisionPoint sentiment charts in the free DecisionPoint Chart Gallery, or you can get the complete suite of indicators by downloading the DecisionPoint Market Indicators ChartPack and the DecisionPoint Rydex Funds ChartPack. The sentiment indicators I reviewed above suggest that money is being removed from the market; and in the case of the Cash Flow Ratio, bear funds and money markets are gaining support. Remember with sentiment, when bearish extremes are met, it is actually contrarian and tells us to look for a bottom. Extremes have not yet been hit, so I find the results above to be bearish.
Technical Analysis is a windsock, not a crystal ball.
Happy Charting!
- Erin
