The S&P 500 SPDR (SPY) and the 7-10 YR T-Bond ETF (IEF) are going their separate ways as opposing wedges takes shape and IEF outperforms SPY (bonds outperform stocks). First, note that I am using close-only price charts to filter out some of the noise few weeks. This includes the ridiculous spike low on August 24th in several ETFs, the pop-and-drop on September 9th in SPY and the Fed-induced volatility on September 17th. Instead of intraday noise, I prefer to focus on closing prices and the overall trends at work.
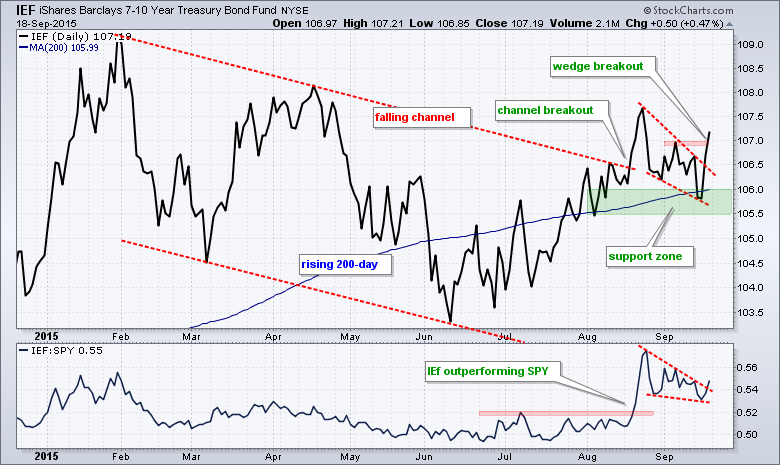
Let's start out with bonds using the 7-10 YR T-Bond ETF (IEF) as our proxy. IEF trended lower from February to June, bottomed in early June and broke a channel trend line in mid August. The ETF also broke back above its rising 200-day simple moving average. Looks like the bigger trend turned up with this move. After the August peak the ETF corrected back to the rising 200-day and support zone with a falling wedge. It looks like this correction has ended because IEF broke out with a surge over the last two days. This breakout is bullish for IEF and chartists can mark support in the 105.5-106 area. The indicator window shows IEF outperforming SPY as the price relative broke out in August, formed a wedge into September and broke out again last week.
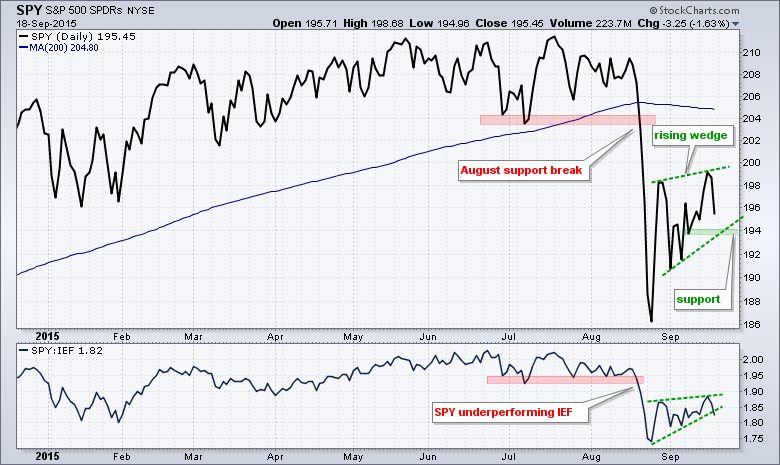
The next chart shows SPY with a rising wedge, which contrasts with the falling wedge in IEF. As with a rising flag, the rising wedge is potentially bearish because it is typical for a correction after a sharp decline. I elected to draw the wedge trend line from the September 1st low because the August spike looks excessive. The wedge is still rising and this means the short-term trend is still up. I am marking support at the September 4th close (193.78). A close below this level would break the wedge trend line and totally erase last week's pop. Such a move would reverse the short-term uptrend and signal a continuation of the bigger downtrend.
******************************************
Thanks for tuning in and have a great weekend!
--Arthur Hill CMT
Plan your Trade and Trade your Plan
*****************************************
