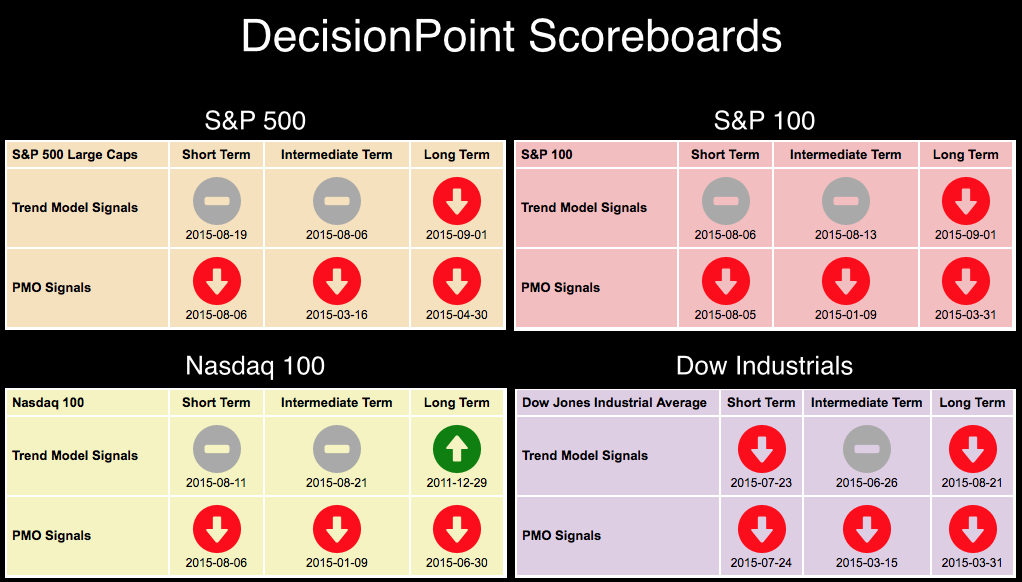
Take a look at the DecisionPoint Scoreboard for last week. (You'll find the Scoreboards in the DecisionPoint Chart Gallery. The link is on the homepage). If you've read any of my articles this week, you'll know that the new Long-Term Trend Model (LTTM) 50/200-EMA crossover SELL signals are a harbinger of doom (or at least have very bearish implications). Both the S&P 500 and S&P 100 joined the Dow Industrials with LTTM SELL signals this week.
The other attention getter right now is the DP Market/Sector Summary (found in the DP Reports Blog daily). The top table in that report displays our timing signals and intermediate-term postures for the top sectors and indexes. Notice that the only "bullish" signal is on TLT.
DECISIONPOINT MARKET/SECTOR SUMMARY DAILY REPORT
Friday, 9/4/2015

************************ DECISIONPOINT MARKET POSTURE ***********************

The following is the market posture suggested by our mechanical trend-
following tools. These are not trading recommendations, rather they are price
activity flags that should be qualified by chart analysis. The Trend Model is
used on all indexes.


                                     Days   Index     09/04   Points  Percent
Index               Posture     Date Elap  @Start     Close      P/L      P/L
------------------- ------- -------- ---- -------   -------  -------  -------
Stocks Medium-Term  Neutral 08/20/15   15   204.01   192.56     ....     ....
Stocks Long-Term    Neutral 08/20/15   15   204.01   192.56     ....     ....
Gold (NY Spot)      Bearish 05/29/15   98  1189.80  1121.40   +68.40    +5.7%
20+Yr T-Bond  (TLT) Bullish 07/31/15   35   122.00   122.68    +0.68    +0.6% <-------
------------------- ------- -------- ---- -------   -------  -------  -------
Dollar Index  (UUP) Neutral 08/21/15   14    24.80    25.13     ....     ....
Commodities   (GSG) Bearish 06/22/15   74    20.79    17.46    +3.33   +16.0%
Crude Oil     (USO) Bearish 07/06/15   60    17.73    15.08    +2.65   +14.9%
------------------- ------- -------- ---- -------   -------  -------  -------
S&P 500       (SPY) Neutral 08/20/15   15   204.01   192.56     ....     ....
S&P Equal Wt  (RSP) Neutral 06/29/15   67    79.60    74.35     ....     ....
Dow           (DIA) Neutral 07/23/15   43   176.59   160.97     ....     ....
Nasdaq 100    (QQQ) Neutral 08/21/15   14   102.59   102.16     ....     ....
NDX Equal Wt (QQEW) Neutral 08/11/15   24    44.15    40.95     ....     ....
S&P 100       (OEF) Neutral 08/20/15   15    89.95    84.90     ....     ....
S&P 400 MidCp (IJH) Neutral 07/07/15   59   150.45   138.66     ....     ....
S&P 600 SmlCp (IJR) Neutral 07/24/15   42   115.08   108.57     ....     ....
Total Market  (VTI) Neutral 08/06/15   29   107.71    99.76     ....     ....
Consumer Disc (XLY) Neutral 08/24/15   11    71.39    73.85     ....     ....
Cons Disc EWt (RCD) Neutral 08/12/15   23    90.05    85.83     ....     ....
Consumer Stpl (XLP) Neutral 08/25/15   10    45.70    46.52     ....     ....
Cons Stpl EWt (RHS) Neutral 08/25/15   10   102.61   105.12     ....     ....
Energy        (XLE)    SELL 06/01/15   95    77.67    63.79   +13.88   +17.9%
Energy EWt    (RYE)    SELL 06/04/15   92    66.39    53.56   +12.83   +19.3%
Financial     (XLF) Neutral 08/24/15   11    22.65    22.65     ....     ....
Financial EWt (RYF) Neutral 08/24/15   11    41.00    40.94     ....     ....
Health Care   (XLV) Neutral 08/21/15   14    71.71    68.68     ....     ....
Health Cr EWt (RYH) Neutral 08/24/15   11   147.61   148.68     ....     ....
Industrial    (XLI) Neutral 06/05/15   91    55.58    50.36     ....     ....
Industrl EWt  (RGI) Neutral 06/08/15   88    88.47    80.78     ....     ....
Materials     (XLB) Neutral 06/25/15   71    49.58    42.05     ....     ....
Materials EWt (RTM) Neutral 06/29/15   67    85.85    76.50     ....     ....
Technology    (XLK) Neutral 08/19/15   16    42.16    39.30     ....     ....
Technolgy EWt (RYT) Neutral 06/30/15   66    90.24    84.73     ....     ....
Utilities     (XLU) Neutral 09/02/15    2    41.34    40.96     ....     ....
Utilities EWt (RYU)    SELL 09/01/15    3    68.66    68.35    +0.31    +0.5%

Average                                37                              +12.6%
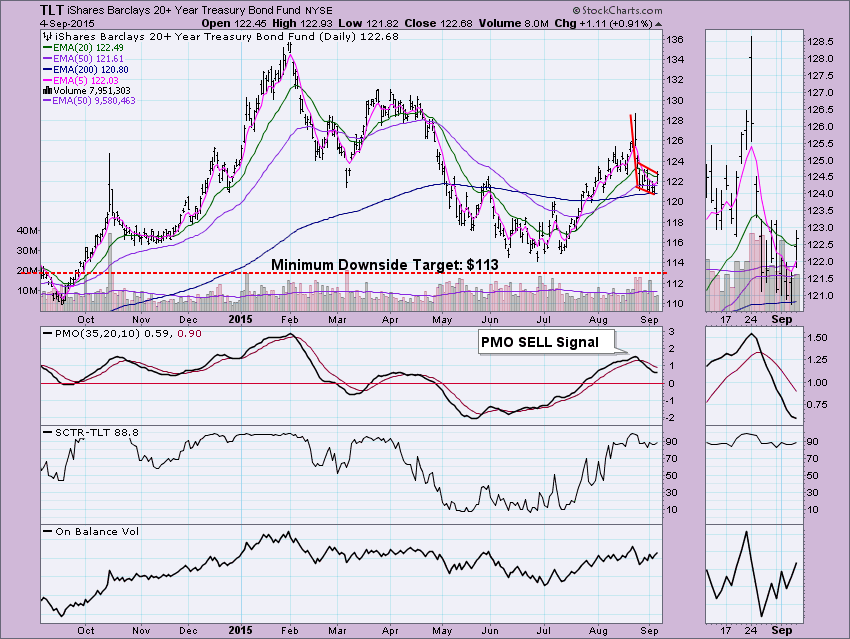
I wrote an article Thursday about TLT. It is far from a bullish set-up right now. Notice the bear flag and Price Momentum Oscillator (PMO) SELL signal. (For more analysis of TLT, check out my Thursday article in the DecisionPoint Blog here.)
I thought about what would turn the current Neutral and SELL signals on the DP Market/Sector Summary to BUY signals. The DecisionPoint Intermediate-Term Trend Model (ITTM) BUY signals are generated by positive 20/50-EMA crossovers. I decided to scan the issues in the Market/Sector Summary to find which ones had rising 20-EMAs. There were only three. The dollar (UUP), oil (USO) and commodities (GSG). Does this mean they have internal strength?
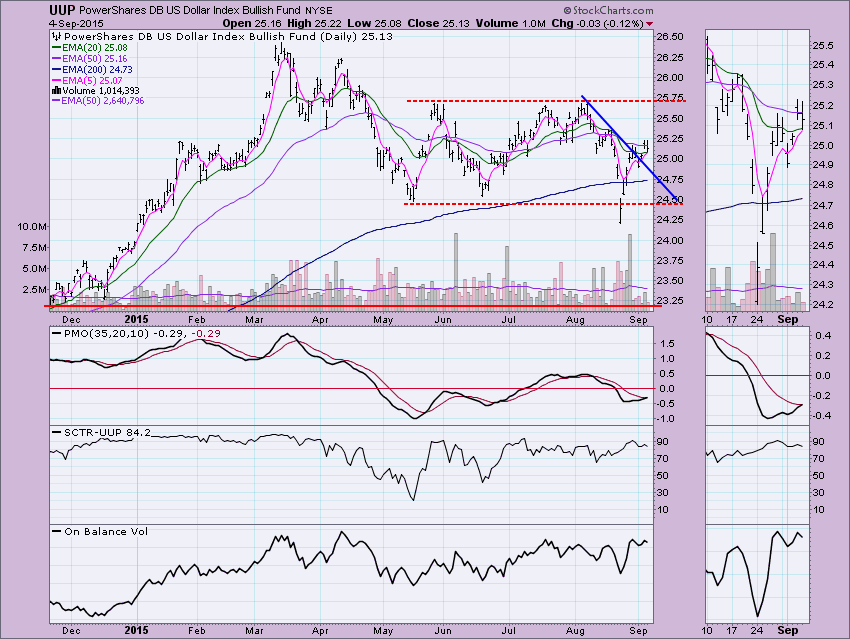
UUP nearly had a Short-Term Trend Model (STTM) BUY signal generate today. The 5-EMA missed crossing the 20-EMA by a few tenths of a point. The dollar has been rising unenthusiastically this week, but it is rising. The PMO missed a BUY signal by thousandths of a point. In reality we can look at this as a BUY signal. Momentum is positive and price broke above the declining tops line. Yet overall it seems the dollar is still undecided. The PMO is leaning bullish.
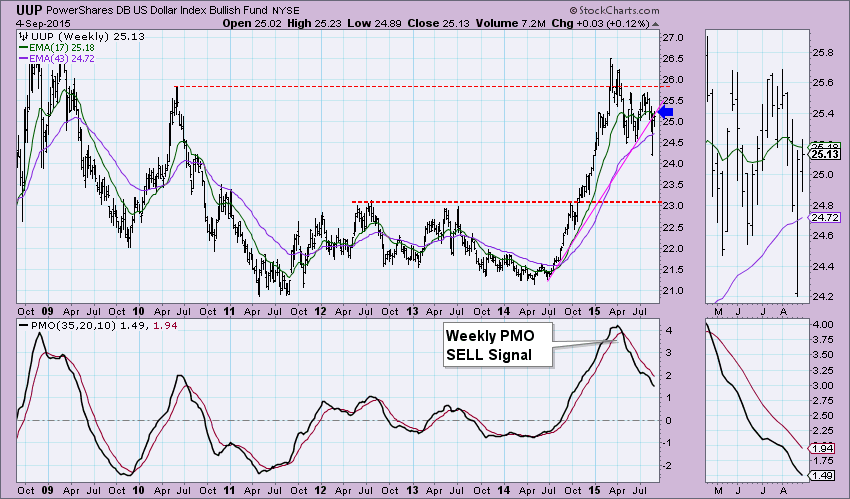
The weekly picture is bearish. Note the PMO is falling with no hesitation and we see that price was unable to break above the rising bottoms trend line. The daily chart is neutral to bullish (I'd consider it bullish when the ITTM BUY signal appears) and a bearish weekly chart leave me less than excited by the dollar's potential.
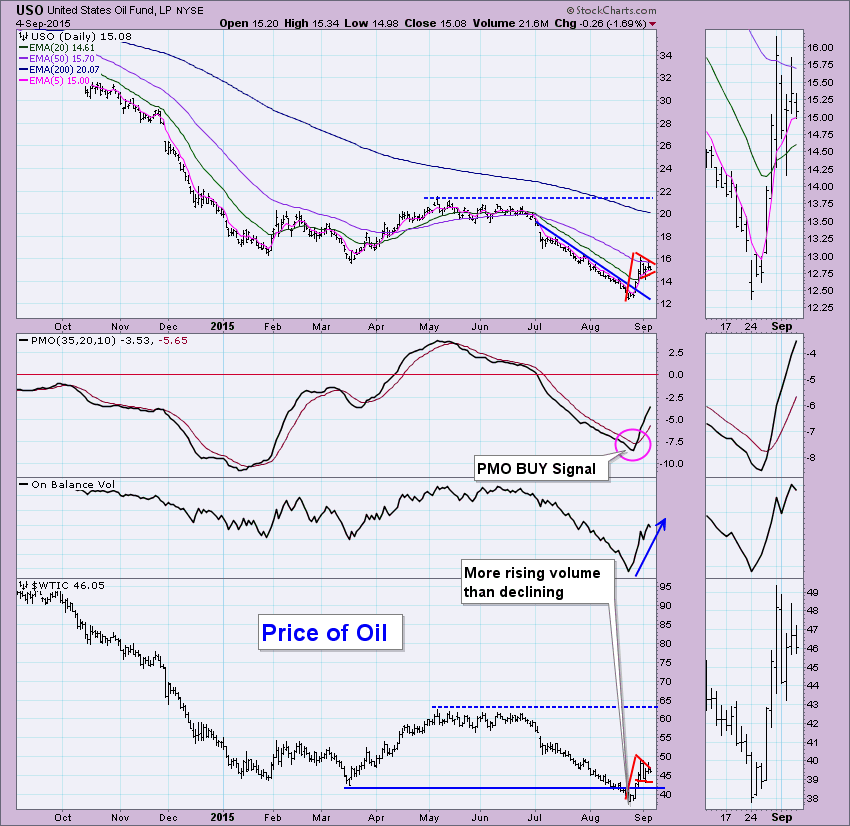
I've annotated bull flags on USO and Oil. I have not done an official calculation of the minimum upside targets, but a guesstimate is about $20.00. The PMO is looking good. Our posture in the intermediate and long terms is bearish, but a positive 20/50-EMA crossover would generate an ITTM BUY signal. USO has a big deficit to overcome to get that signal, but if this bull flag executes, it would be no problem to produce that signal.
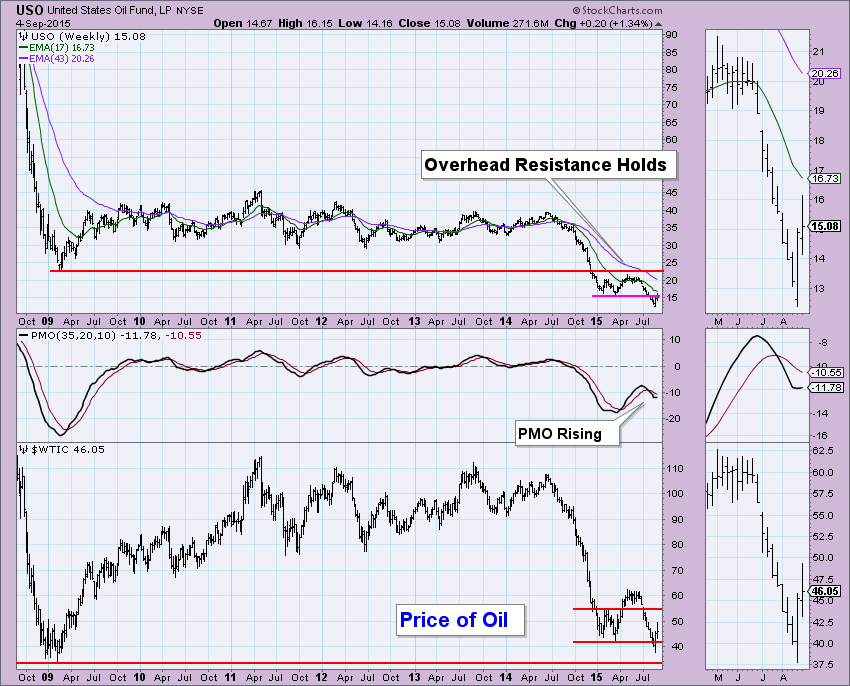
The weekly chart is improving somewhat. The weekly PMO is rising now. If you note the last PMO bottoms compared to the price bottoms, there is a positive divergence. Oil is holding well above long-term support at $30. I'd like to see USO close above resistance next week.
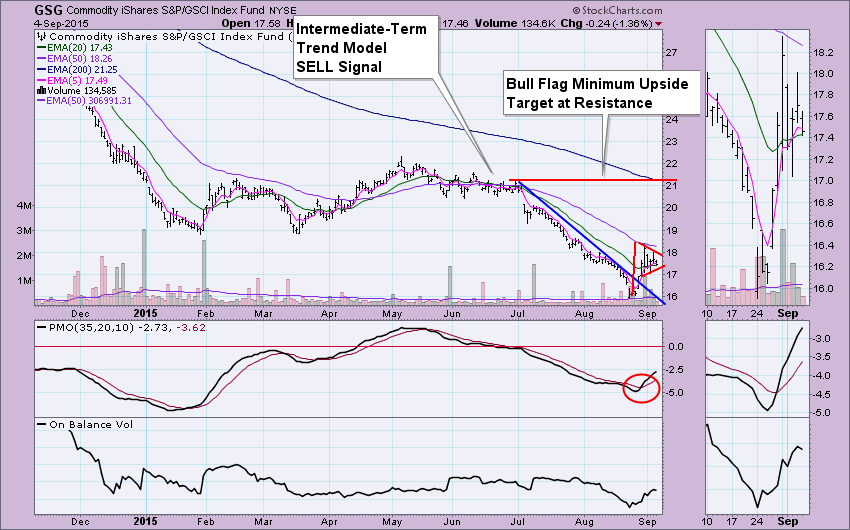
The final rising 20-EMA belongs to GSG, the Commodity ETF. Clearly the picture is very similar to that of Oil which is included in GSG. The bull flag and PMO crossover BUY signal is positive. I like that the OBV has been rising, suggesting that volume is higher on positive closes.
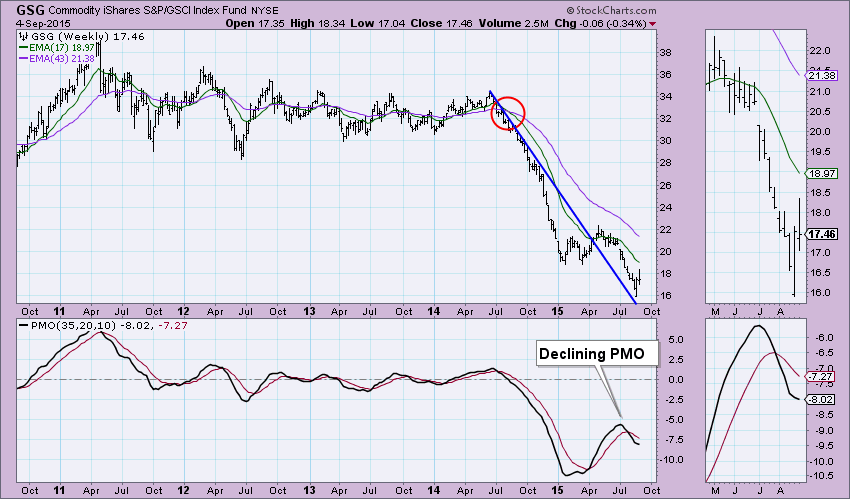
The weekly picture is neutral to bearish. Price is staying above the declining tops line, but the PMO is falling after a SELL signal and although it is decelerating, readings are well below zero which is bearish.
Conclusion: There are positive set-ups on these three ETFs in the shorter-term and our DP indicators are confirming that. The intermediate term is murky on the weekly charts. I discussed my findings with our resident commodities expert, Greg Schnell (author of the "Commodities Countdown" Blog) to get his "take". He explained that seasonality is positive for Oil right now but that he and others don't expect it to hold at $50 too much longer. We agree that the dollar is undecided. China is a big factor and Monday's trading should provide us some insight on what to expect Tuesday.
