One of the areas I like to watch is the global arena. When the markets around the world are breaking down it can be a good warning signal for the US markets. Obviously, the big drop from the parabolic rise of the Shanghai market has been a concern globally. But I also like to watch Japan. As the third largest economy in the world and a highest level of debt to GDP, I like to keep an eye on this market. Currently the government program of Abenomics has involved a massive Quantitative Easing package. While this package usually attracts investors to the Japanese market, the dropping Yen has also been a part of the QE strategy. Recently both charts [the Yen ($XJY) and the ($NIKK)] have reversed direction which is the reason that it is timely to examine what is happening in Asia.
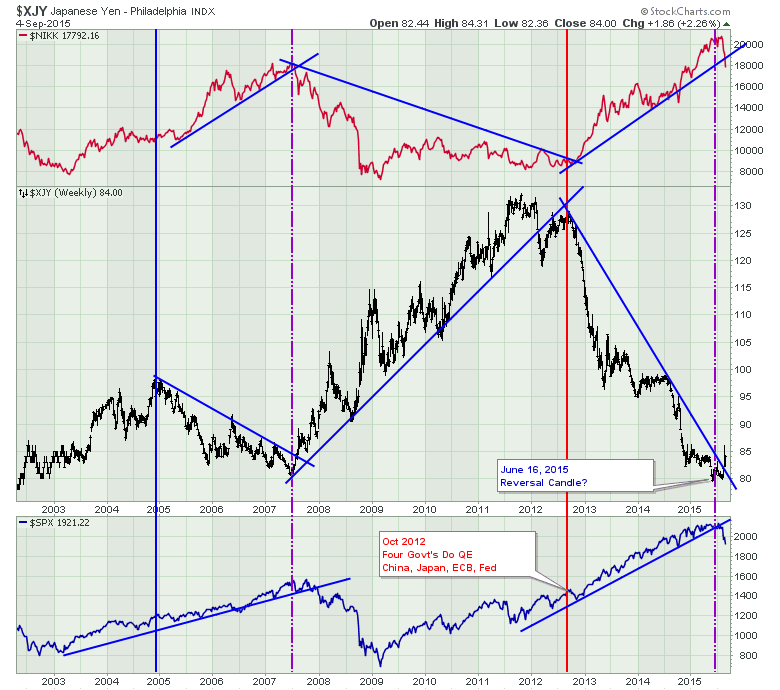
Let's look at the Yen first. In the centre of the chart below is the Japanese Yen ($XJY). The turning points in the Yen have been at major historical turning points for the overall equity market in Japan. The low in the Yen currently is the same as the low level in the Yen that occurred at the 2007 equity market top in the Nikkei ($NIKK) and the S&P 500. It is interesting to me that the Japanese market rolled over so strongly recently while the Yen looks like it is trying to rise above resistance.
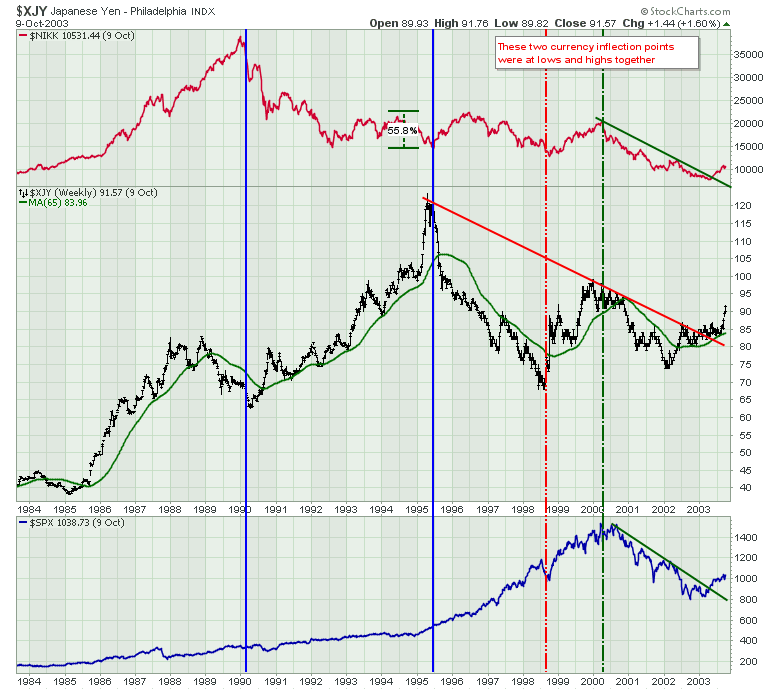
The Yen looked different in some of the other major market tops in the Nikkei. The chart below shows the Nikkei top in 1990 and the chart ends in 2003. The $NIKK topped out at 38000 back in 1990. Since then the government has been fighting to restore the economic strength of Japan. The one year rally in the $NIKKEI after the Asian financial crisis was over 50% as shown on the chart so the flatness of the $NIKK chart should not be underrated. The Asian financial crisis in 1998 as well as the market top in 2000 had the Yen ($XJY) and the $NIKK move directionally together (which is different that the last 10 years shown above) and to some extent the low in 2003 was the same. All that to indicate some of the biggest turning points in the market were associated with big turning points in the Yen. The opposing direction was not always a condition.
So I am very suspicious of a major top if the Yen continues to move higher. With trend lines broken all over the world, let's look at the Shanghai correlation. The chart below has the Shanghai ($SSEC) as a red area chart, the $SPX is shown in blue on top of the Shanghai chart and the CYB is the ETF that tracks the Chinese Yuan (CYB).
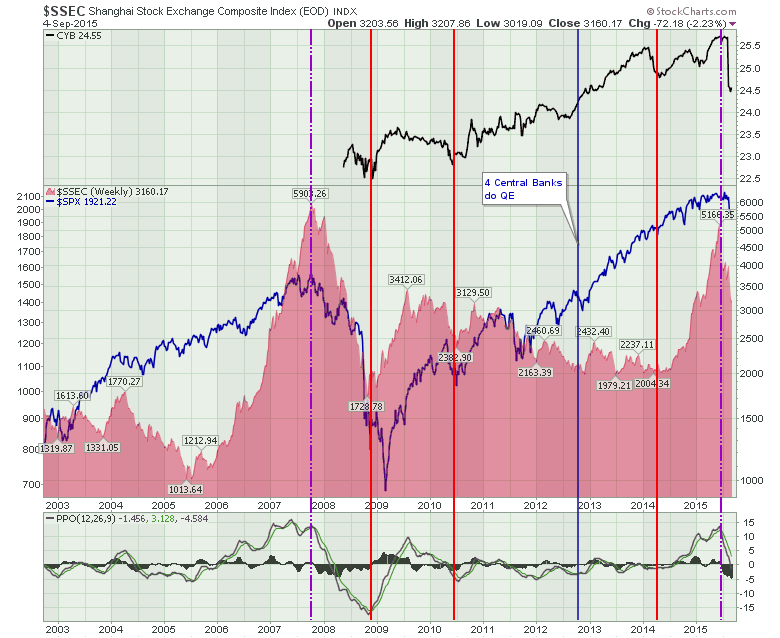
The break in the Shanghai in 2007 corresponded with a US market top. We don't have currency ETF information for the 2007 period but the current pattern shows a currency breakdown in China corresponding with a Shanghai stock market that has broken down more than 40% and it corresponds with major breaks in the US market and Japan.
In summary, the three major economies in the world are all moving lower together and we have one major currency trend change in the Yuan and it looks like the Yen is reversing. While the $USD is stuck in the middle of the 2015 trading range, it would appear this current period has all the makings of a major top in the 3 largest economies of the world. If it proves not to be a major top, this would appear to be a rare situation where all these correlations did not matter. In the fullness of time we will know but caution is definitely warranted. I think any weekly close above 0.865 on the Yen ($XJY) on Chart 1 would probably confirm the market condition.
Good trading,
Greg Schnell, CMT
