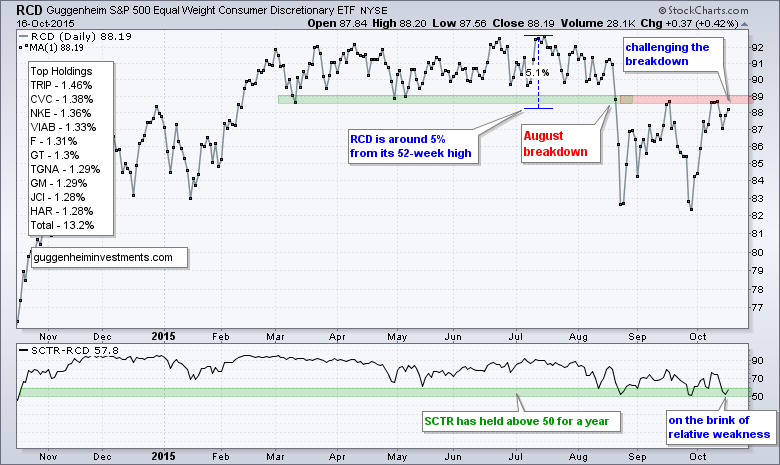
Large caps continue to outperform "other" caps and this has created a performance discrepancy within the consumer discretionary sector. I am highlighting this sector because it is the most economically sensitive sector and includes many domestically focused industry groups, including retail, restaurant, media and home construction. The first chart shows the Equal-Weight Consumer Discretionary ETF (RCD) for an idea of how the "average" stock in the consumer discretionary sector is performing. The ETF broke down in August, tested broken support in mid-September and surged back to this zone here in mid-October. RCD is making a bid to negate its support break. The indicator window shows the StockCharts Technical Rank (SCTR) holding above 50 for the past year. The SCTR ranges from zero to one hundred. The closer to 100 the ETF is, the more relative strength it shows. The ETF has remained in the top half of our ETF universe so far and this means the cup is still half full. A break below 50 would put RCD in the bottom half and make the cup half empty.
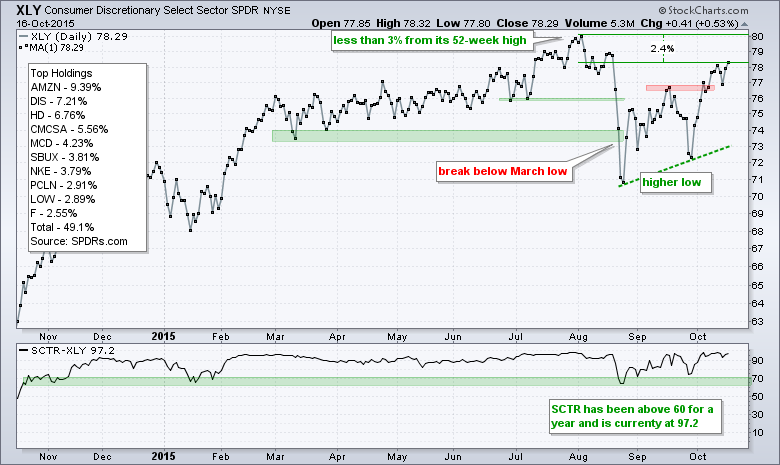
The sector discrepancy is apparent when we look at the Consumer Discretionary SPDR (XLY), which is near a 52-week high and sporting a strong SCTR. Notice that the SCTR held above 60 the past year and is currently at 97, which makes is one of the strongest ETFs in our universe. While the equal-weight consumer discretionary is around 5% from its 52-week high and on the brink of relative weakness, the cap-weighted consumer discretionary sector is doing just fine and leading the market.
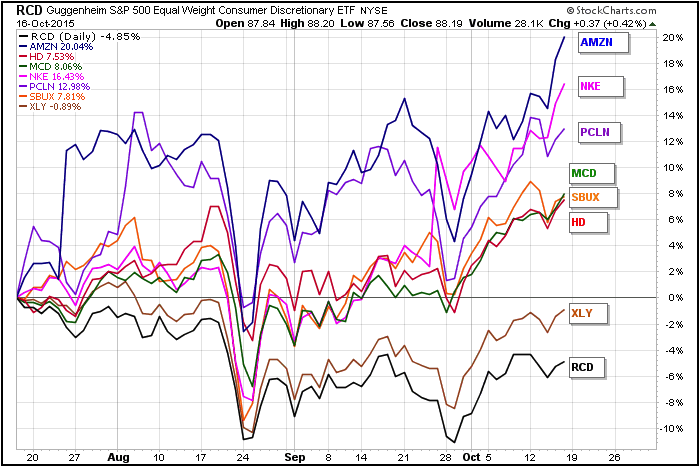
Why is XLY so much stronger than RCD? One only has to look at the ETF's top holdings and the individual weightings to understand the performance discrepancy. The top ten holdings were shown on each chart. The performance SharpChart below shows the 3-month percentage change for six of the top ten stocks. Notice that RCD is down 4.85% and XLY is down just .89%, and holding up much better. Relative strength in XLY can be attributed to strength in Amazon, Nike, PriceLine, McDonalds, Starbucks and Home Depot. Together, these large-cap stocks account for around 30% of XLY and these stocks are leading. While I am concerned with relative weakness in the average stock in the consumer discretionary sector, I am impressed with relative strength in XLY and its top holdings.
You can follow me on twitter (@arthurhill). You can see a complete SCTR table for our ETF universe here and you can read more about the SCTR methodology here.
****************************************
Thanks for tuning in and have a good weekend!
--Arthur Hill CMT
Plan your Trade and Trade your Plan
*****************************************
