The Oil & Gas Equip & Services SPDR (XES) perked up on Friday with a massive engulfing pattern on high volume. Combined with a bullish failure swing in RSI, the ETF could be setting up for a tradable low.
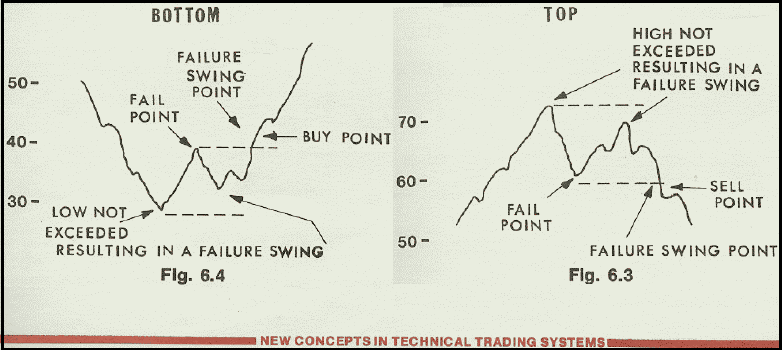
Created by Welles Wilder, the Relative Strength Index (RSI) is a classic momentum oscillator that has stood the test of time. The image below, which comes from his book, New Concepts in Technical Trading Systems (1978), details the top and bottom failure swings. A bottom failure swing occurs when RSI dips below 30, bounces, retreats, fails to break back below 30 and turns up. The "buy point" triggers when RSI breaks its prior peak, which Wilder called the "fail point". The opposite occurs for a top failure swing and 70 becomes the key level.
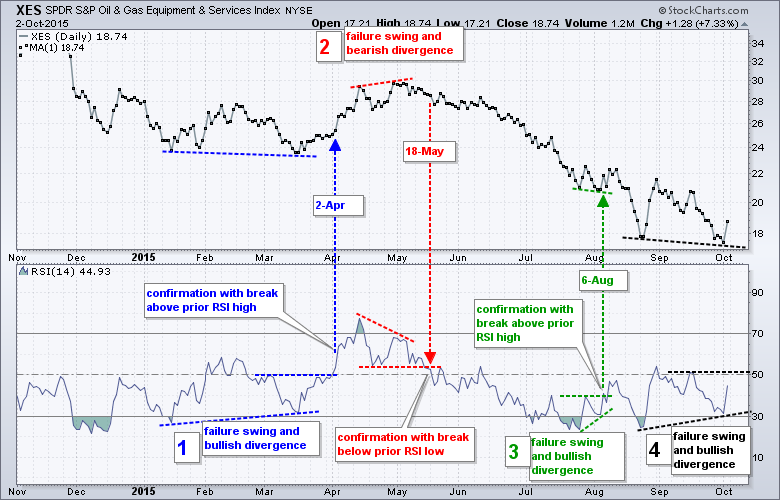
The chart below shows three completed failure swings and one working failure swing. The blue annotations show a bullish failure swing and a bullish divergence. Note that Wilder also used divergences, but a divergence is not required for a failure swing. A bullish divergence occurs when the security forms a lower low and the indicator forms a higher high. The opposite occurs for a bearish divergence. The bullish signal on April 2nd would have made for a good short-term trade. The bearish signal on May 18th was a dandy and the bullish signal on August 6th was a loser. Another bullish failure swing is setting up now and a break above 52 in RSI would trigger Wilder's buy point.
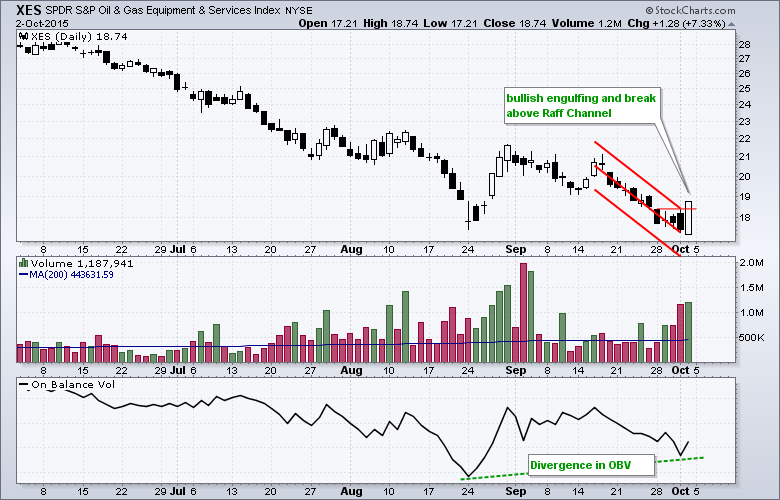
In addition to the setup in RSI, the Oil & Gas Equip & Services SPDR is showing signs of accumulation as its firms near the August low. First, note that the ETF opened below Thursday's low and closed above Thursday's high. This is a bullish engulfing pattern and a key outside reversal day. In fact, Friday's candle engulfed the prior four candlesticks and occurred on the highest volume since early September. The indicator window quantifies volume with the On Balance Volume (OBV) indicator. XES closed below its 24-Aug closing low, but OBV held above this low and a small bullish divergence is working. This suggests that some accumulation is underway in XES.
So what now? Well, the overall trend for XES is clearly down and going long now would be a bottom picking exercise, and bottom picking can be like a box of chocolates. Oil is also in a downtrend overall, but a wedge-triangle formed over the last four weeks and an upside breakout would be short-term bullish. Oil and XES are highly correlated so a breakout in oil would also be bullish for XES. My thinking here is to watch the September range in oil, which I will be following in the Art's Charts blog throughout the week.
*******************************************
Thanks for tuning in and have a great weekend!
--Arthur Hill CMT
Plan your Trade and Trade your Plan
*******************************************
