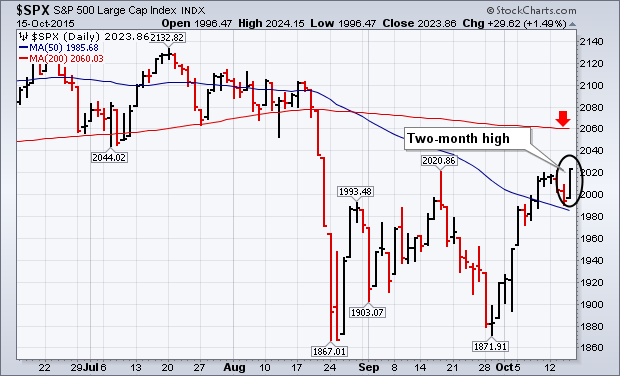
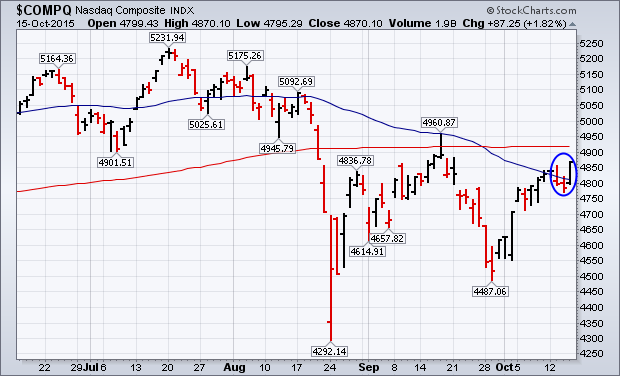
U.S. stocks continued the rally that started in late September. On Thursday, the Dow Industrials gained 217 points (1.2%) to extend its rally. The first chart below shows the S&P 500 gaining an even stronger 1.5%. More importantly, the SPX closed at 2023 which exceeded its mid-September intra-day peak at 2020. That put the SPX at a new two month high. The Nasdaq was even stronger. The middle chart shows the Nasdaq Composite gaining 1.8%, and closing above its 50-day average for the first time since before the market slide in August. The fact that small caps did even better is a good sign. The Russell 2000 Small Cap Index ($RUT) gained 2.2% to regain its 50-day average. All market sectors rose with the biggest gainers in financials (2.4%); a 4% gain in biotechs led a healthcare gain of 2.6%; and energy (1.8%). Consumer discretionary stocks rose 1.2% to regain all of yesterday's losses and more. All of those gains were extended on Friday.
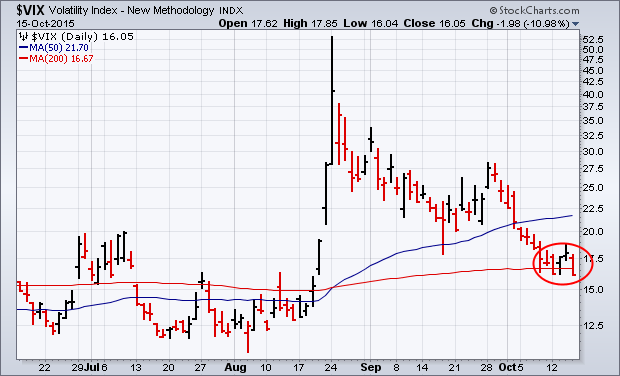
To top it off, the last chart shows the CBOE Volatility Index ($VIX) falling -10% to close at a two-month low. The VIX closed below its 200-day average on Thursday and moved lower on Friday. The big question is whether global stock indexes will be able to exceed their 200-day lines in the coming days.
- John Murphy
