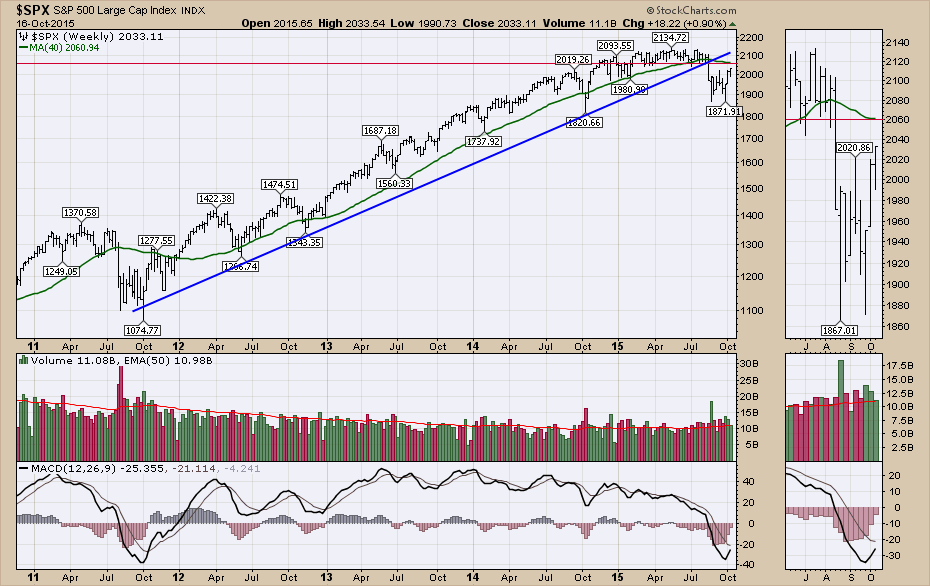
The Technical Analyst community is very mixed at this junction on the charts. Many of the senior professionals are suggesting a long-term bottom has been put in on October 1 and a race to higher highs is underway. Others have their indicators turning down and believe we have started a new bear market. I am in the camp with a new long-term bear market based on my indicators and I am watching for how the market behaves as we approach resistance up above these levels. This weekly chart of the $SPX shows the market approaching the 40 WMA from the bottom side and the horizontal resistance is at the same level as shown in the zoom panel.
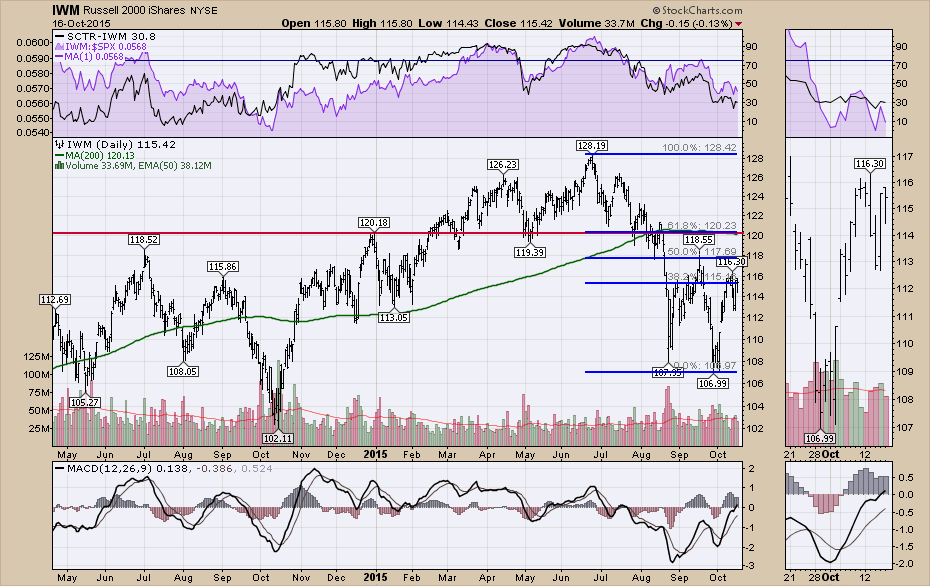
One of the trickiest times to be in the market is the first initial swing from bull to bear market. My webinar of October 8, 2015, laid out many of the reasons why my technical indicators have me in the camp that we have a top in place. That webinar link can be found here. October 8, 2015, Webinar. The webinar focused on the $SPX and the majority of market signals related to the US markets. The Russell 2000 also has critical resistance overhead and matches very closely with Fibonacci retracement levels.
The 200 DMA, the horizontal support / resistance line, and the 61.8% Fibonacci retracement level are all at the same level (120) above the current price on the Russell 2000 Tracking ETF (IWM).
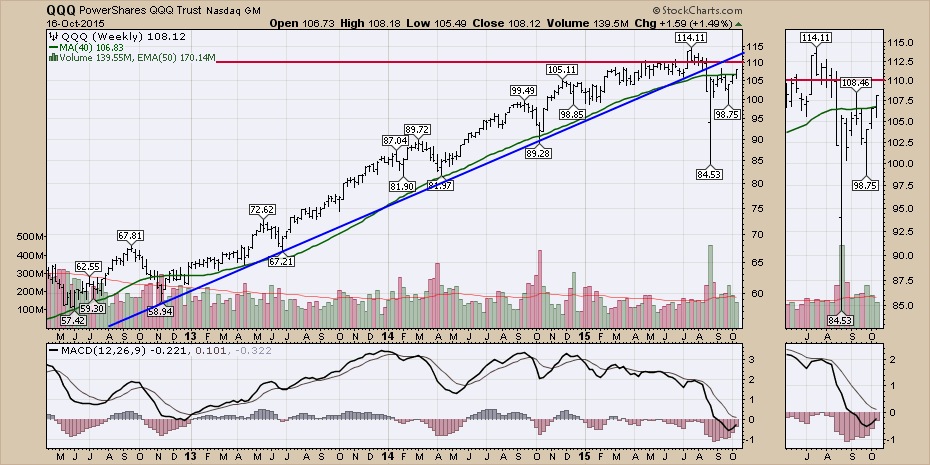
Lastly, the NASDAQ 100 Tracking ETF (QQQ) has been the major growth index through the last 6 years. It has also been the strongest index. Three possibilities exist for the index in terms of resistance. One is the horizontal resistance at 110. The market surged above it in early July, all in one week. From that week, the support of 110 lasted for 4 or 5 weeks and then failed. This will be important again. The second possibility is the backtest of the blue uptrend line and the third is the former highs at $114.11. These two points seem to be converging at the $114 level so this will be interesting.
Now that we are in the middle of earnings season, we have enough catalysts to make the market break one way or the other. How the price responds to these three setups for resistance will tell us all we need to know in terms of the trend change. Don't hit the snooze button. It should be remarkably important either way.
Good trading,
Greg Schnell, CMT
