ChartWatchers November 22, 2015 at 10:27 PM

Hello Fellow ChartWatchers! The markets had a very good week last week and are trying to climb above lots of built-up resistance from earlier in the year. On the Dow chart, that means that the index struggles each time it nears 18,000 - something it is doing once again... Read More
ChartWatchers November 22, 2015 at 08:54 PM
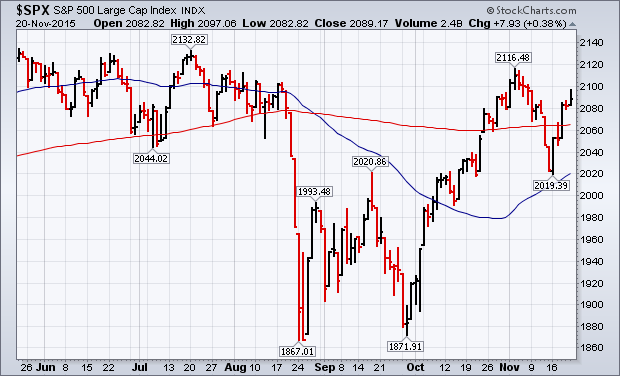
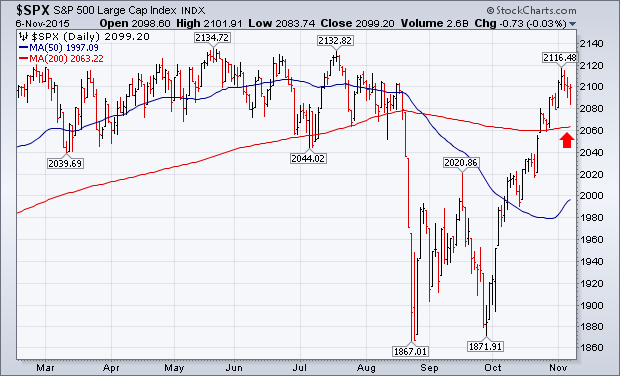
S&P 500 REGAINS ITS 200-DAY AVERAGE -- EQUAL WEIGHTED VERSION LAGS... This time last week, the S&P 500 Index had fallen back below its 200-day average and was testing chart support at its September peak at 2020 (and its 50-day moving average)... Read More
ChartWatchers November 21, 2015 at 05:52 PM
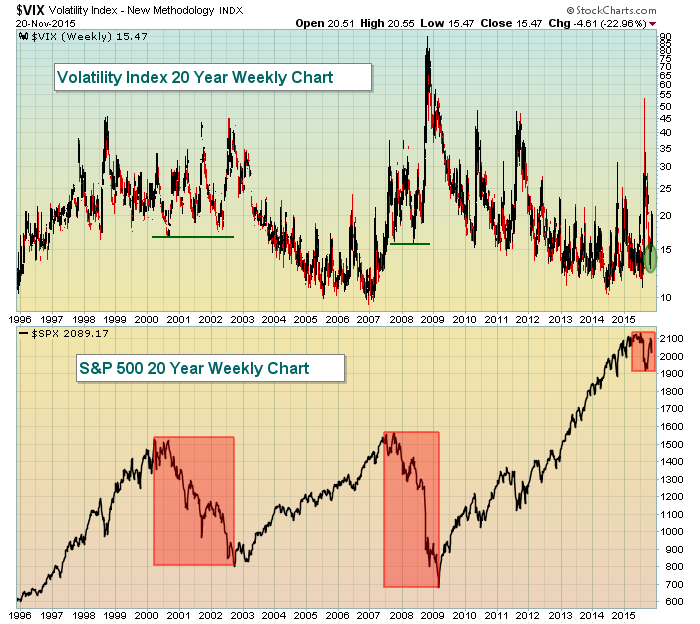
On the surface, the rout that took place in August has been completely reversed and, three months later, it's like nothing ever happened, right? Wrong. What has happened is that the S&P 500 rose from August 19th's close of 2079.61 to Thursday, November 19th's close of 2081... Read More
ChartWatchers November 21, 2015 at 02:25 PM
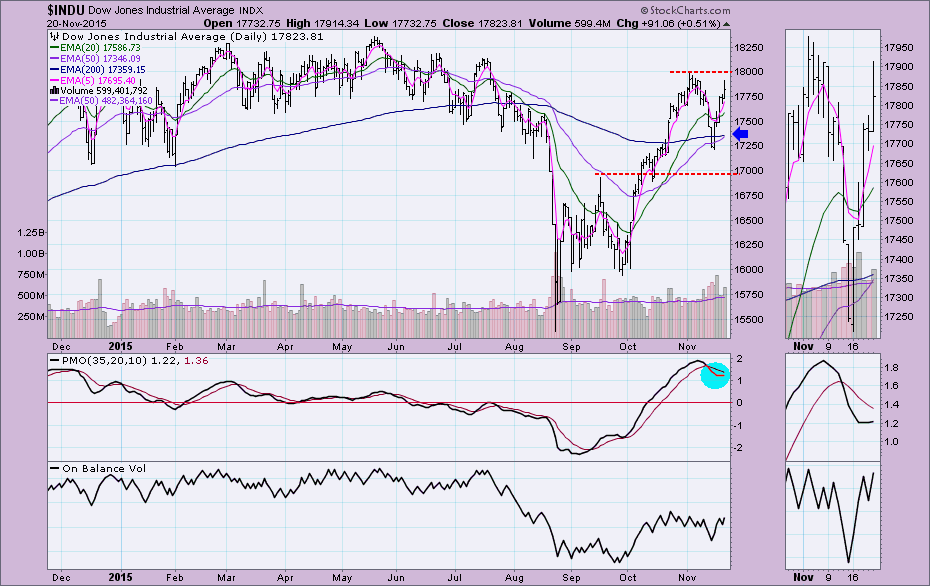
The most recent bounce/rally was impressive, pushing prices toward overhead resistance at the November high or even to all-time highs. The problem is that during that rally, the Price Momentum Oscillator (PMO) didn't react. It did turn negative momentum to "positive" but barely... Read More
ChartWatchers November 21, 2015 at 01:56 PM
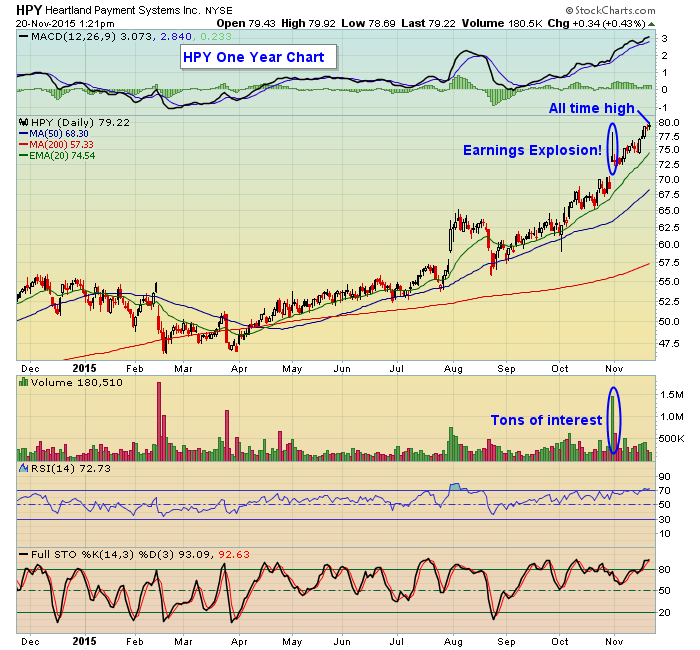
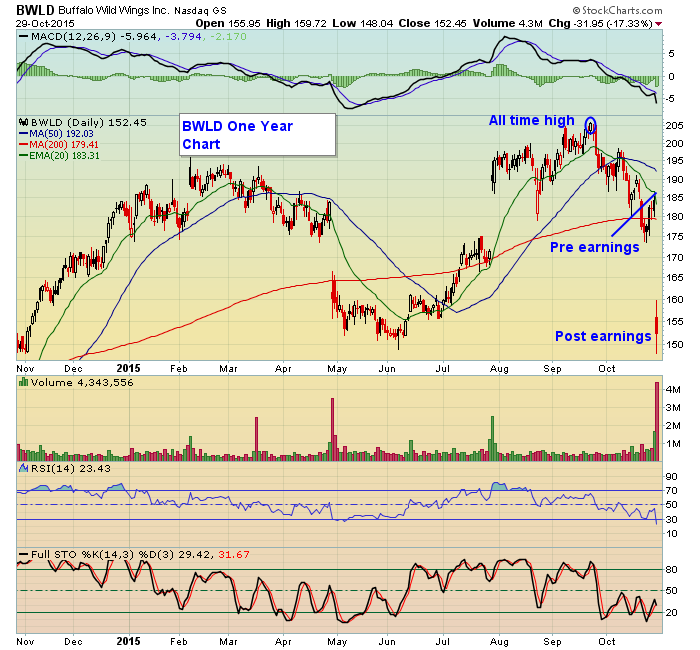
At EarningsBeats.com we focus squarely on stocks that beat earnings expectations and also have strong charts... Read More
ChartWatchers November 21, 2015 at 12:00 AM
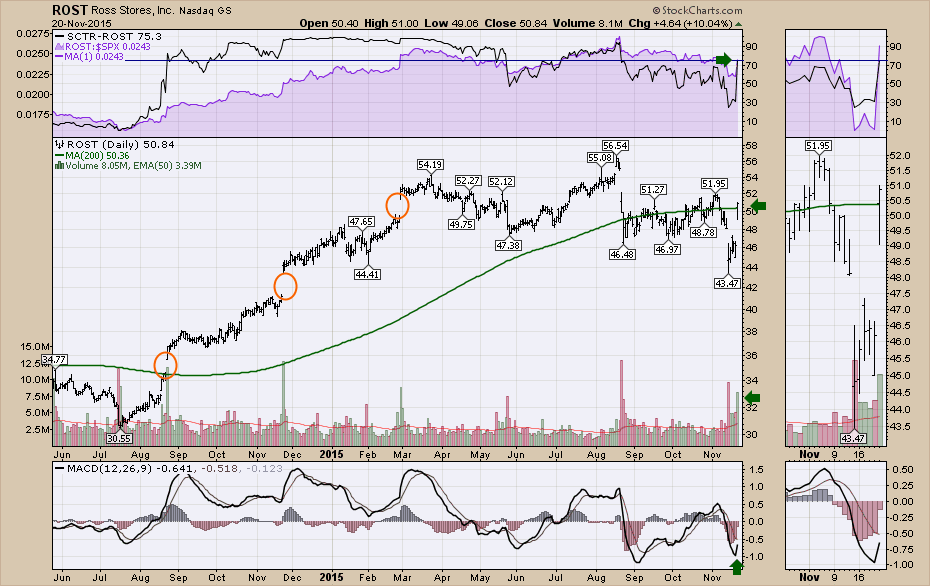
Heading into Christmas, Apparel Retailing has been a pretty difficult industry group for those who were optimistic on it. This week saw a few apparel retailers start to surge... Read More
ChartWatchers November 20, 2015 at 04:19 PM
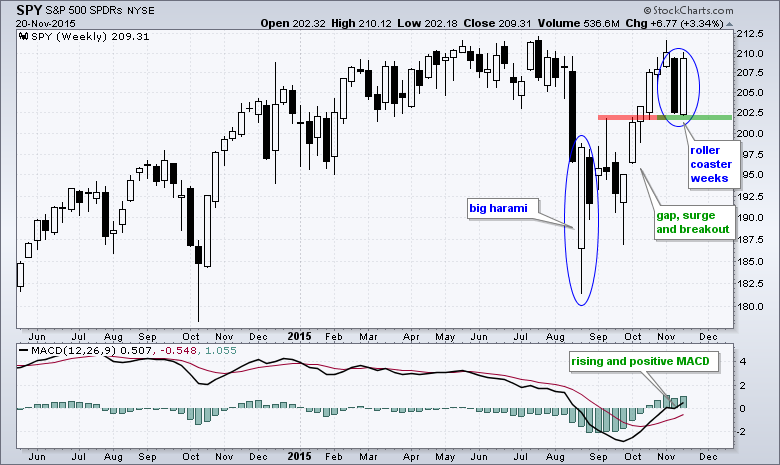
The S&P 500 SPDR (SPY) acted just like a roller coaster the last two weeks. It took traders for a wild ride and then dropped them off right where they started - a little frazzled no doubt. SPY opened near 209 on Monday, November 9th, and then plunged to close near 202... Read More
ChartWatchers November 08, 2015 at 11:26 AM
Earnings season has been in high gear the past few weeks with thousands of companies reporting their numbers. So far the results have been mixed but maybe better than most expected with the S&P now back to within striking range of its all time high... Read More
ChartWatchers November 07, 2015 at 07:57 PM
Friday's jobs report caused some minor profit-taking in major stock indexes, but not enough to alter the current uptrend. The chart below shows the S&P 500 dropping slightly Wednesday through Friday (but closing up for the week)... Read More
ChartWatchers November 07, 2015 at 07:37 PM
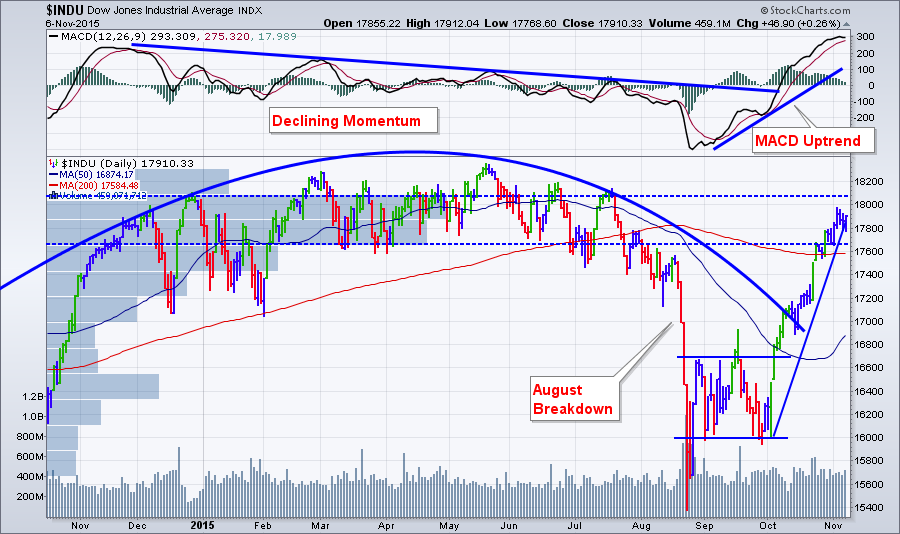
Hello Fellow ChartWatchers! We're pretty busy today re-vamping our network security systems so I only have time for a quick post with two important points: 1.) The Dow has shot up a ton recently and is ready for a pull-back... Read More
ChartWatchers November 07, 2015 at 12:05 PM
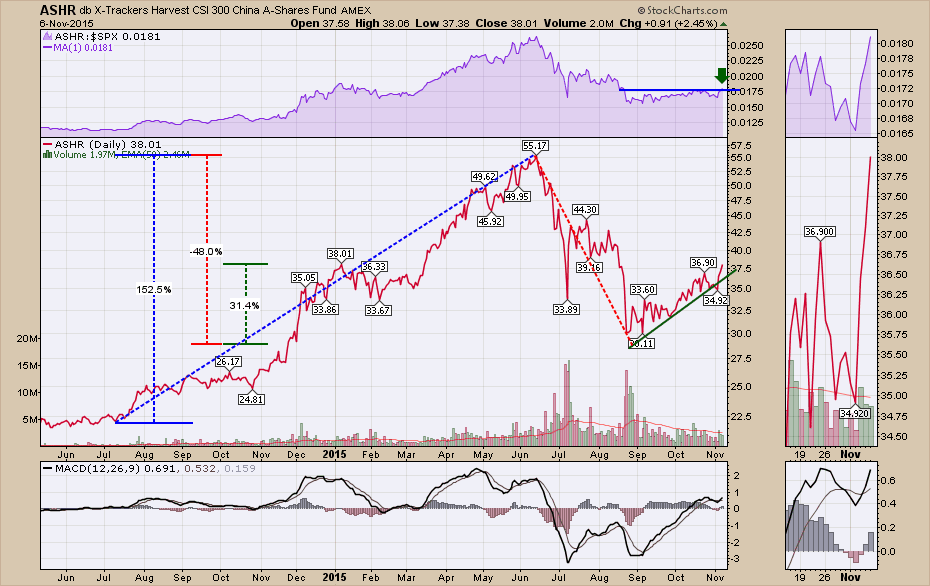
China (ASHR) has been a roller coaster for investors in the system. After making a meteoric rise of 150% in one year, the prices dropped by 48% and have now risen 31%. Today marks a very interesting place on the charts... Read More
ChartWatchers November 07, 2015 at 08:34 AM
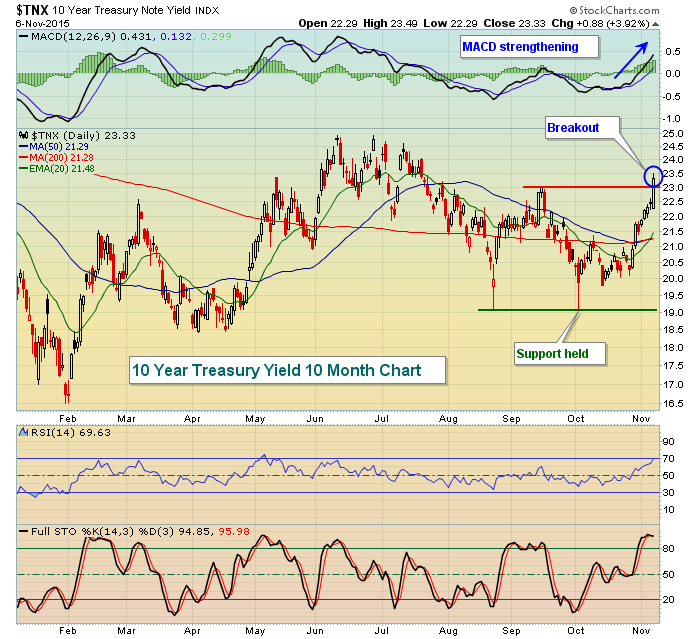
The employment report showed that 271,000 jobs were added in October, above even the highest estimate and that sent traders flocking out of treasuries. But what was bad news for treasuries was great news for banks... Read More
ChartWatchers November 07, 2015 at 07:57 AM
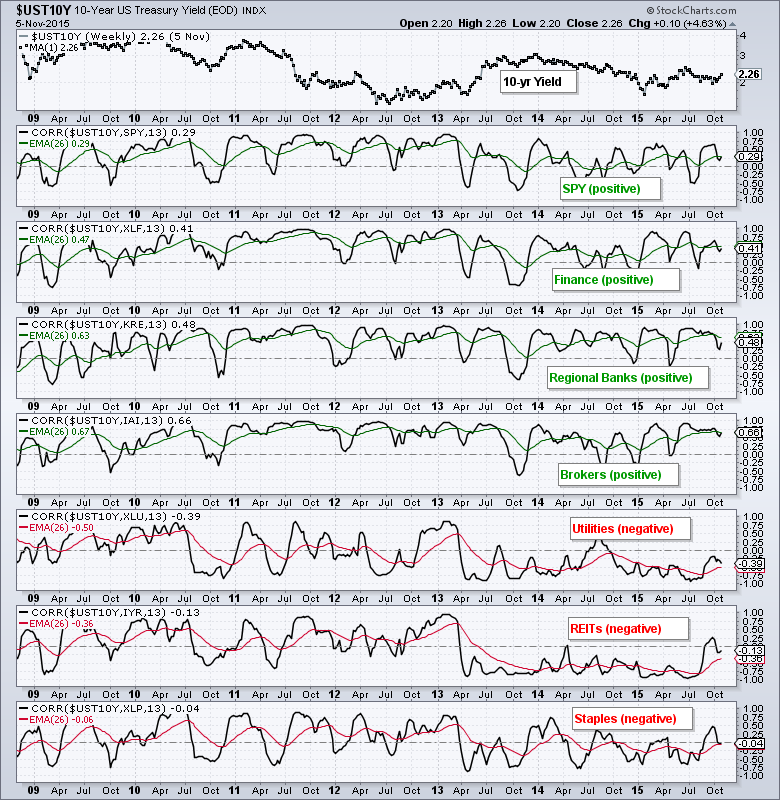
Chartists can use the Correlation Coefficient to understand the relationship between Treasury yields and certain groups, such as banks, utilities and REITs... Read More
ChartWatchers November 06, 2015 at 09:37 PM
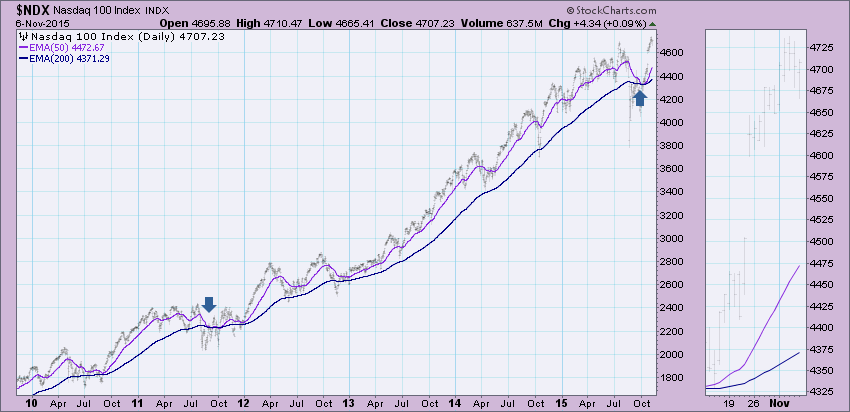
Let me preface this article by defining bull and bear markets according to DecisionPoint. DecisionPoint considers 50/200-EMA crossovers the distinguishing factor between a bull market and bear market. These crossovers are what determine the Long-Term Trend Model signals... Read More