Hello Fellow ChartWatchers!
Welcome back to reality - just in time for Christmas! Reality is a place where interest rates are not stuck at zero. It's a place where the yield curve actually moves from time-to-time. It's a place we all know that we need to get back to and it appears we are on our way. The journey could get bumpy, but StockCharts has some of the best "seats" for watching things unfold along the way - starting with our Dynamic Yield Curve. Compare the yield curve from July 2007 (the upper red line) with today's yield curve (at the bottom):
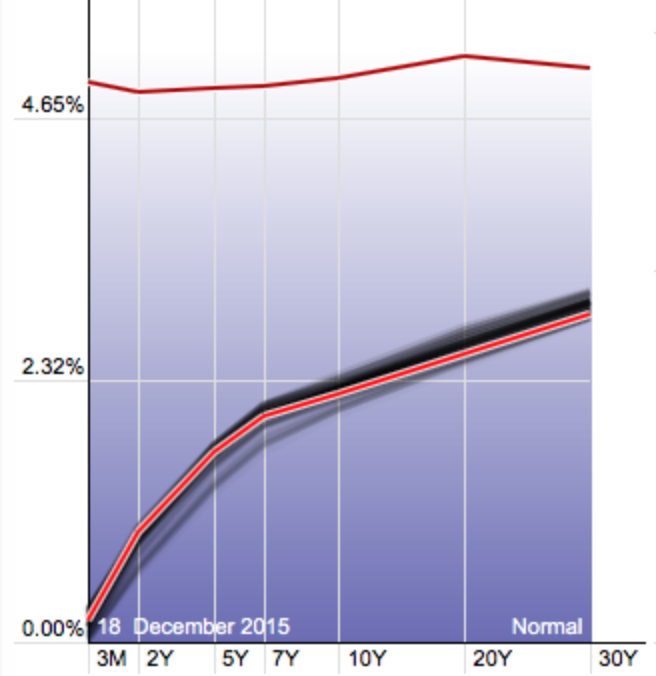
It is that gap that the Fed is looking to (slowly - very slowly) bridge. Click here to play with our free Dynamic Yield Curve tool. Just click and drag on the S&P 500 chart on the right to see a more complete history of interest rates and their relationship to the stock market.
Of course, the end of "free money" will have a big impact on the stock market itself and StockCharts remains the best place to watch that unfold as well. Here's the current high-level "scorecard:"
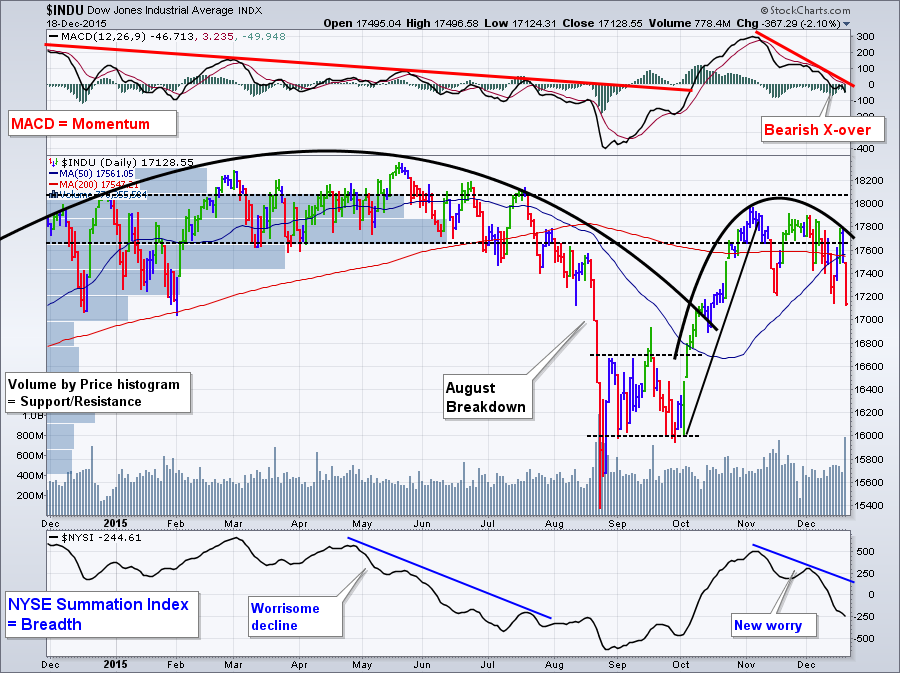
As I explained during the first half of last week's "ChartWatchers" webinar, the Dow is has failed to break through overhead resistance that built up around 18000 during the first half of the year. You can see that using the horizontal "Volume by Price" histogram bars on the left side of the chart. That resistance has caused the Dow to lose all of its upward momentum (see the MACD line at the top of the chart) and falter just as the 50-day MA (blue) caught up with the 200-day MA (red). (That "bullish" crossover signal will almost certainly prove to be wrong and is a great case study as to why you can't just mechanically follow Moving Average signals.) In addition, we see that market breadth is also eroding again via the McClellan Summation Index (bottom panel).
Bottom Line: Blech. The Grinch is here and he wants his Christmas back. There's nothing bullish about the technical picture at the moment.
Still, those are two great charts to watch over the coming days, weeks, and months. They will tell you - better than any talking head - what's really happening as we enter "the new world."
Merry Christmas and Happy Holidays everyone!
- Chip
P.S. Oh yeah - I have two presents for you! First, don't forget to read these two free eBooks from our website: John Murphy's "Charting Made Easy" and Alexander Elder's "Step-by-Step Trading with StockCharts.com" Both books are easy-to-read and not-too-long (and free!). Even if you are an experienced chart watcher, these are great to re-review.
Second, if you are new to the website or you feel overwhelmed by everything Technical Analysis has to offer, please review the recording of last week's ChartWatchers webinar. In it, I go over the key things that all technicians need to focus on to make money in any market. The feedback from the people that attended the live version of this webinar was extremely positive and I wanted to make sure that everyone had a chance to see it.
