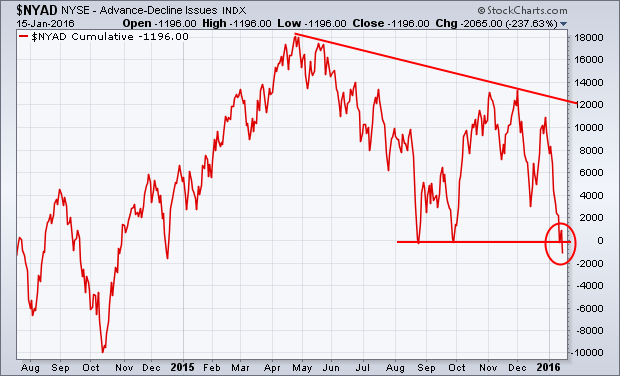
A lot of us on this site have been warning about the fact that the fourth quarter rally was mainly driven by large cap stocks and wasn't being supported by the vast majority of stocks. That's been shown by breakdowns in small and midsize stocks and the fact that 80% of big board stocks have fallen below their 200-day averages. The best known measure of market breadth is the NYSE Advance-Decline line. Chart 1 shows that line falling well short of its 2015 high during the fourth quarter, which was an early warning. This week's drop below its August/September lows to a 52-week low is another. That puts the AD line in its first downtrend since the bull market started seven years ago. That's a bad sign for the stock market.
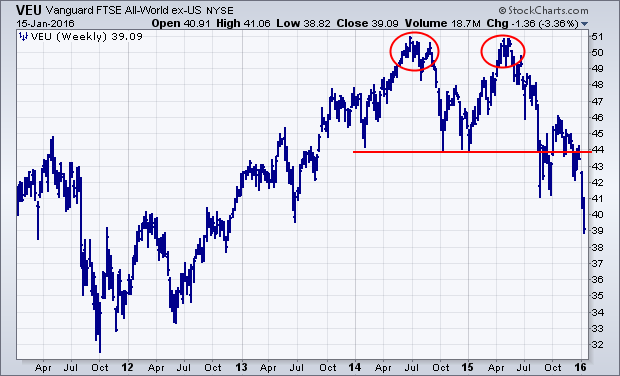
The concept of "market breadth" also applies to global stocks. In a healthy uptrend, most stocks markets should be rising. When most are falling, that 's bad for everyone. I've been pointing out the fact that foreign shares have been much weaker than the U.S. and have already started to break down. That's not good for them or us. The weekly bars in Chart 2 show the Vanguard FTSE All-World ex-US ETF (VEU) falling to a three-year low after having completed a "double top" reversal pattern (see circles). The VEU has lost -22% since last spring and is in a bear market. That includes developed and emerging markets. EAFE iShares (which measure foreign developed markets) has fallen to a two-year low, while Emerging Markets iShares are trading at the lowest level since 2009. It's pretty tough for the U.S. to hold up when the rest of the world is in a downtrend. Global stocks also become more highly correlated during downtrends. That increases the odds that we've started to follow them lower.
BOTTOM LINE... With foreign stocks in a bear market, U.S. stocks are in danger of following suit. Internal market measures show that the market is already much weaker than the major stock indexes. That also increases the odds that 2015 lows will be broken. If that happens, the S&P 500 could lose another 10-12% before reaching major support. Sector rotations also show that investors have been rotating toward defensive consumer staples and utilities, and have been selling economically-sensitive stocks. Commodity-related stocks are still being sold hard. Countries tied to commodities are being hit especially hard, as are their currencies. Chinese stocks and the yuan are sinking together. The dollar and yen are the only two currencies holding up. A firm dollar is keeping downside pressure on commodities. Money leaving stocks is moving into the safety of Treasury bonds and gold (not to mention cash). That's what normally happens in times of financial stress. Economists are starting to worry about the health of the U.S. economy. Stock selling suggests investors are worried too. On a lighter note, enjoy the three-day weekend. We can all use a timeout.
