I was recently at an event where someone suggested a simple Technical Analysis 101 of the current market. Today, I want to do that in one chart.
There are some simple theories in the market. When the market is going down, the volatility picks up. Using some of the most common tools of Technical Analysis, this market breakdown has been coming for a while. The point of this review is to identify signals that can help us spot the market trend and when it might end in either direction.
This is the $SPX with one of the simplest indicators. The 40 Week Moving Average shown in green. When the market is below the 40 WMA and the average is pointed down, we have to be aware of the possibility of a market breaking lower. Notice how the market had trouble getting back above the 40 WMA for the last 3 major tops in 2000 and 2007. You'll also notice both 2010 and 2011. The Federal Reserve acted during the low points in the market in 2008, 2010, and 2011. The last QE was late 2012 through to October 2014.
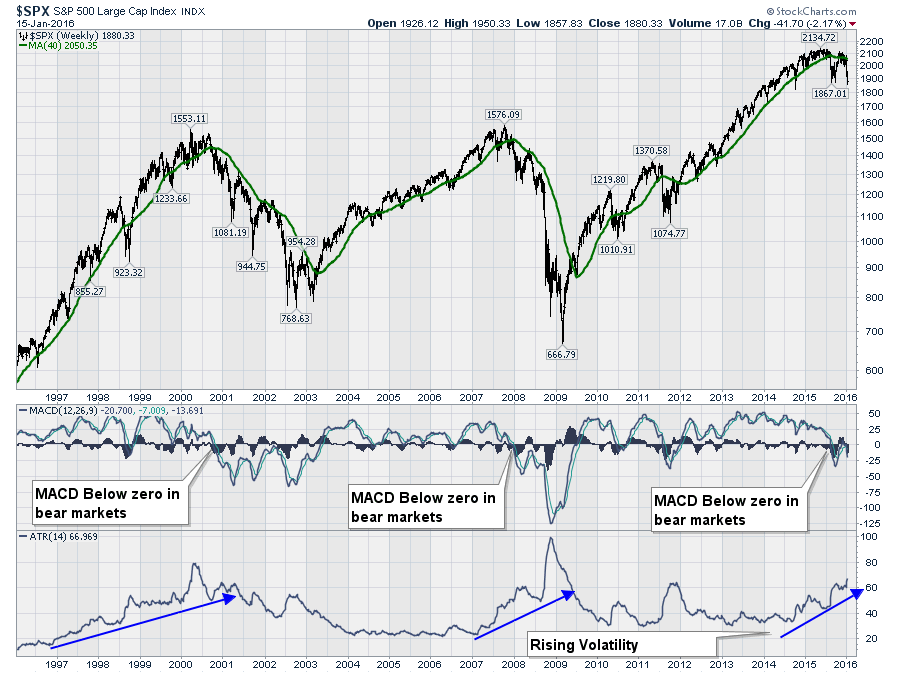
I have duplicated the same chart above and posted it below to help avoid scrolling. The second indicator is the MACD. The MACD uses two different moving averages and it helps indicate market momentum. To use a driving analogy, one moving average is the average speed for one hour driving around town, where the other moving average is for one minute around the city. You can imagine how they can be different as you speed up to leave the city (shorter moving average rises up faster) and then they both become the same as you spend a long time at highway speeds. In declining momentum, you have a long period at highway speeds, and you slow down as you enter the city limits. The longer we spend in the city limits the lower our long-term average speed. When we use these different moving averages in the stock market, it helps us see acceleration (prices moving higher quickly) and deceleration ( a slowing down of the market speed). Looking at the MACD, notice the MACD started dropping near the end of 2014 from 'highway' speeds. More importantly, when the MACD rolls over at or near zero after going below zero initially, this really confirms a very slow or bearish market momentum. We are actually going in reverse when the momentum is declining and below zero. This means lower prices. We have recently stopped accelerating from the late September lows and started decelerating while near zero which is a major clue that the market is very weak. In the big picture, this market could be expected to move lower over the next few months based on the direction of the MACD. Normally the negative momentum slows down before it starts rising. Right now it is accelerating downward.

Next is the ATR. This measures the Average True Range or the wide swings in the market. (We calculate the distance between the market high for the week and subtract the market low for the week = 1 weeks range). Add up all the ranges for a number of weeks (14) and divide by the number of weeks (14) will give you an Average True Range. In the chart above, we have used 14 weeks which is the default setting. Based on the theory that the volatility increases as the market moves lower, we can see the ATR has been rising since QE ended in 2014.
Probably the most important signal on the chart is that we have all three signals in place for a bear market at the same time. The market is below the 40-week moving average, the momentum is dropping and below zero, which means lower prices, and the volatility is rising meaning the markets are more volatile. That increase in volatility happens in falling markets. While there will be tradeable rallies for a few weeks at a time, the big picture is the market is working its way lower. Each week gives us more data and as the market changes, we will keep analysing the data. Notice that when the stock market actually bottomed in 2003 and 2009, the ATR or the volatility, had been dropping for a long period of time.
For now, some of the short-term indicators that are not shown, are signalling deeply oversold. I posted an article on the Don't Ignore This Chart blog on Friday. How Do You Approach This $NYHL Chart? This article is a great example how oversold the market is currently as we registered an extreme level that has only been reached during the collapse of Lehman Brothers. So, while the mood is bearish, it is also at a level where we would expect the market to bounce from, just to ease the oversold condition. When the volatility is this high, stops are very important as is position size.
If you would like more information about the current market, I would encourage you to watch some of the webinars by following this link ( Upcoming webinars ) or watch the recordings of the webinars. You can go back a long way to hear about how the weakness in the market was developing. (Webinar Archives). It is this constant review with new information that creates the value in Technical Analysis.
You can also follow me on Twitter @schnellinvestor. If you would like to be kept up to date as these indicators roll along, follow these links to get email updates. Commodities Countdown. and The Canadian Technician. Click the big green YES button at the bottom of each of the articles. With lots of quality articles, you can follow each of the writers on their blogs. Arthur, Tom and I all post on the Don't Ignore This Chart blog so you can get an almost daily update. Be careful out there, but don't be surprised if we get a brief rally overt the next few weeks. It does not look like a long-term change from the downtrend at this point. But that's why we review the new information on the charts each week.
Good trading,
Greg Schnell, CMT
